PNC Bank 2013 Annual Report Download - page 233
Download and view the complete annual report
Please find page 233 of the 2013 PNC Bank annual report below. You can navigate through the pages in the report by either clicking on the pages listed below, or by using the keyword search tool below to find specific information within the annual report.-
 1
1 -
2
-
3
-
4
-
5
-
6
-
7
-
8
-
9
-
10
-
11
-
12
-
13
-
14
-
15
-
16
-
17
-
18
-
19
-
20
-
21
-
22
-
23
-
24
-
25
-
26
-
27
-
28
-
29
-
30
-
31
-
32
-
33
-
34
-
35
-
36
-
37
-
38
-
39
-
40
-
41
-
42
-
43
-
44
-
45
-
46
-
47
-
48
-
49
-
50
-
51
-
52
-
53
-
54
-
55
-
56
-
57
-
58
-
59
-
60
-
61
-
62
-
63
-
64
-
65
-
66
-
67
-
68
-
69
-
70
-
71
-
72
-
73
-
74
-
75
-
76
-
77
-
78
-
79
-
80
-
81
-
82
-
83
-
84
-
85
-
86
-
87
-
88
-
89
-
90
-
91
-
92
-
93
-
94
-
95
-
96
-
97
-
98
-
99
-
100
-
101
-
102
-
103
-
104
-
105
-
106
-
107
-
108
-
109
-
110
-
111
-
112
-
113
-
114
-
115
-
116
-
117
-
118
-
119
-
120
-
121
-
122
-
123
-
124
-
125
-
126
-
127
-
128
-
129
-
130
-
131
-
132
-
133
-
134
-
135
-
136
-
137
-
138
-
139
-
140
-
141
-
142
-
143
-
144
-
145
-
146
-
147
-
148
-
149
-
150
-
151
-
152
-
153
-
154
-
155
-
156
-
157
-
158
-
159
-
160
-
161
-
162
-
163
-
164
-
165
-
166
-
167
-
168
-
169
-
170
-
171
-
172
-
173
-
174
-
175
-
176
-
177
-
178
-
179
-
180
-
181
-
182
-
183
-
184
-
185
-
186
-
187
-
188
-
189
-
190
-
191
-
192
-
193
-
194
-
195
-
196
-
197
-
198
-
199
-
200
-
201
-
202
-
203
-
204
-
205
-
206
-
207
-
208
-
209
-
210
-
211
-
212
-
213
-
214
-
215
-
216
-
217
-
218
-
219
-
220
-
221
-
222
-
 223
223 -
 224
224 -
 225
225 -
 226
226 -
 227
227 -
 228
228 -
 229
229 -
 230
230 -
 231
231 -
 232
232 -
 233
233 -
 234
234 -
 235
235 -
 236
236 -
 237
237 -
 238
238 -
 239
239 -
 240
240 -
 241
241 -
 242
242 -
 243
243 -
244
-
245
-
246
-
247
-
248
-
249
-
250
-
251
-
252
-
253
-
254
-
255
-
256
-
257
-
258
-
259
-
260
-
261
-
262
-
263
-
264
-
265
-
266
 |
 |

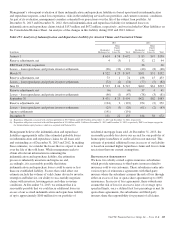
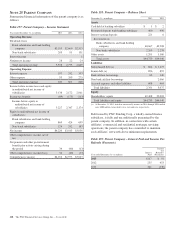
Management’s subsequent evaluation of these indemnification and repurchase liabilities is based upon trends in indemnification
and repurchase requests, actual loss experience, risks in the underlying serviced loan portfolios, and current economic conditions.
As part of its evaluation, management considers estimated loss projections over the life of the subject loan portfolio. At
December 31, 2013 and December 31, 2012, the total indemnification and repurchase liability for estimated losses on
indemnification and repurchase claims totaled $153 million and $672 million, respectively, and was included in Other liabilities on
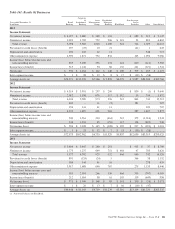
the Consolidated Balance Sheet. An analysis of the changes in this liability during 2013 and 2012 follows:
Table 153: Analysis of Indemnification and Repurchase Liability for Asserted Claims and Unasserted Claims
2013 2012
In millions
Residential
Mortgages (a)
Home
Equity
Loans/
Lines (b) Total
Residential
Mortgages (a)
Home
Equity
Loans/
Lines (b) Total
January 1 $ 614 $ 58 $ 672 $ 83 $47 $130
Reserve adjustments, net 4 (3) 1 32 12 44
RBC Bank (USA) acquisition 26 26
Losses – loan repurchases and private investor settlements (96) (30) (126) (40) (8) (48)
March 31 $ 522 $ 25 $ 547 $101 $51 $152
Reserve adjustments, net 73 1 74 438 15 453
Losses – loan repurchases and private investor settlements (72) (2) (74) (77) (5) (82)
June 30 $ 523 $ 24 $ 547 $462 $61 $523
Reserve adjustments, net (6) (6) 37 4 41
Losses – loan repurchases and private investor settlements (46) (1) (47) (78) (3) (81)
September 30 $ 471 $ 23 $ 494 $421 $62 $483
Reserve adjustments, net (124) 2 (122) 254 (2) 252
Losses – loan repurchases and private investor settlements (25) (3) (28) (61) (2) (63)
Agency settlements (191) (191)
December 31 131 22 153 614 58 672
(a) Repurchase obligation associated with sold loan portfolios of $91.9 billion and $105.8 billion at December 31, 2013 and December 31, 2012, respectively.
(b) Repurchase obligation associated with sold loan portfolios of $3.6 billion and $4.3 billion at December 31, 2013 and December 31, 2012, respectively. PNC is no longer engaged in
the brokered home equity business, which was acquired with National City.
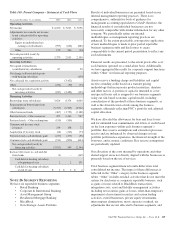
Management believes the indemnification and repurchase
liabilities appropriately reflect the estimated probable losses
on indemnification and repurchase claims for all loans sold
and outstanding as of December 31, 2013 and 2012. In making
these estimates, we consider the losses that we expect to incur
over the life of the sold loans. While management seeks to
obtain all relevant information in estimating the
indemnification and repurchase liability, the estimation
process is inherently uncertain and imprecise and,
accordingly, it is reasonably possible that future
indemnification and repurchase losses could be more or less
than our established liability. Factors that could affect our
estimate include the volume of valid claims driven by investor
strategies and behavior, our ability to successfully negotiate
claims with investors, housing prices and other economic
conditions. At December 31, 2013, we estimate that it is
reasonably possible that we could incur additional losses in
excess of our accrued indemnification and repurchase liability
of up to approximately $100 million for our portfolio of
residential mortgage loans sold. At December 31, 2013, the
reasonably possible loss above our accrual for our portfolio of
home equity loans/lines of credit sold was not material. This
estimate of potential additional losses in excess of our liability
is based on assumed higher repurchase claims and lower claim
rescissions than our current assumptions.
R
EINSURANCE
A
GREEMENTS
We have two wholly-owned captive insurance subsidiaries
which provide reinsurance to third-party insurers related to
insurance sold to our customers. These subsidiaries enter into
various types of reinsurance agreements with third-party
insurers where the subsidiary assumes the risk of loss through
either an excess of loss or quota share agreement up to 100%
reinsurance. In excess of loss agreements, these subsidiaries
assume the risk of loss for an excess layer of coverage up to
specified limits, once a defined first loss percentage is met. In
quota share agreements, the subsidiaries and third-party
insurers share the responsibility for payment of all claims.
The PNC Financial Services Group, Inc. – Form 10-K 215