PNC Bank 2013 Annual Report Download - page 145
Download and view the complete annual report
Please find page 145 of the 2013 PNC Bank annual report below. You can navigate through the pages in the report by either clicking on the pages listed below, or by using the keyword search tool below to find specific information within the annual report.-
 1
1 -
2
-
3
-
4
-
5
-
6
-
7
-
8
-
9
-
10
-
11
-
12
-
13
-
14
-
15
-
16
-
17
-
18
-
19
-
20
-
21
-
22
-
23
-
24
-
25
-
26
-
27
-
28
-
29
-
30
-
31
-
32
-
33
-
34
-
35
-
36
-
37
-
38
-
39
-
40
-
41
-
42
-
43
-
44
-
45
-
46
-
47
-
48
-
49
-
50
-
51
-
52
-
53
-
54
-
55
-
56
-
57
-
58
-
59
-
60
-
61
-
62
-
63
-
64
-
65
-
66
-
67
-
68
-
69
-
70
-
71
-
72
-
73
-
74
-
75
-
76
-
77
-
78
-
79
-
80
-
81
-
82
-
83
-
84
-
85
-
86
-
87
-
88
-
89
-
90
-
91
-
92
-
93
-
94
-
95
-
96
-
97
-
98
-
99
-
100
-
101
-
102
-
103
-
104
-
105
-
106
-
107
-
108
-
109
-
110
-
111
-
112
-
113
-
114
-
115
-
116
-
117
-
118
-
119
-
120
-
121
-
122
-
123
-
124
-
125
-
126
-
127
-
128
-
129
-
130
-
131
-
132
-
133
-
134
-
 135
135 -
 136
136 -
 137
137 -
 138
138 -
 139
139 -
 140
140 -
 141
141 -
 142
142 -
 143
143 -
 144
144 -
 145
145 -
 146
146 -
 147
147 -
 148
148 -
 149
149 -
 150
150 -
 151
151 -
 152
152 -
 153
153 -
 154
154 -
 155
155 -
156
-
157
-
158
-
159
-
160
-
161
-
162
-
163
-
164
-
165
-
166
-
167
-
168
-
169
-
170
-
171
-
172
-
173
-
174
-
175
-
176
-
177
-
178
-
179
-
180
-
181
-
182
-
183
-
184
-
185
-
186
-
187
-
188
-
189
-
190
-
191
-
192
-
193
-
194
-
195
-
196
-
197
-
198
-
199
-
200
-
201
-
202
-
203
-
204
-
205
-
206
-
207
-
208
-
209
-
210
-
211
-
212
-
213
-
214
-
215
-
216
-
217
-
218
-
219
-
220
-
221
-
222
-
223
-
224
-
225
-
226
-
227
-
228
-
229
-
230
-
231
-
232
-
233
-
234
-
235
-
236
-
237
-
238
-
239
-
240
-
241
-
242
-
243
-
244
-
245
-
246
-
247
-
248
-
249
-
250
-
251
-
252
-
253
-
254
-
255
-
256
-
257
-
258
-
259
-
260
-
261
-
262
-
263
-
264
-
265
-
266
 |
 |
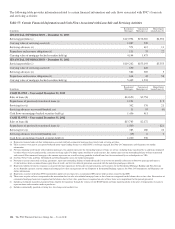
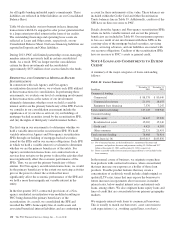
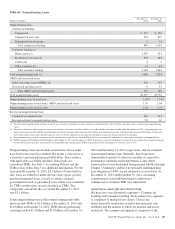
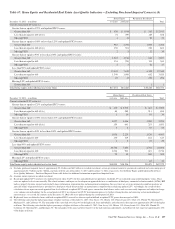
The table below presents information about the principal
balances of transferred loans not recorded on our balance
sheet, including residential mortgages, that we service.
Additionally, the table below includes principal balances of
commercial mortgage securitization and sales transactions
where we service those assets. Serviced delinquent loans are
90 days or more past due.
Table 58: Principal Balance, Delinquent Loans (Loans 90
Days or More Past Due), and Net Charge-offs Related to
Serviced Loans
In millions
Residential
Mortgages
Commercial
Mortgages
Home Equity
Loans/Lines (a)
Serviced Loan Information –
December 31, 2013
Total principal balance $85,758 $62,872 $4,902
Delinquent loans 3,562 2,353 1,985
Serviced Loan Information –
December 31, 2012
Total principal balance $97,399 $67,563 $5,353
Delinquent loans 4,922 3,440 1,963
In millions
Residential
Mortgages
Commercial
Mortgages
Home Equity
Loans/Lines (a)
Year ended December 31,
2013
Net charge-offs (b) $213 $916 $119
Year ended December 31,
2012
Net charge-offs (b) $303 $978 $262
(a) These activities were part of an acquired brokered home equity lending business in
which PNC is no longer engaged. See Note 24 Commitments and Guarantees for
further information.
(b) Net charge-offs for Residential mortgages and Home equity loans/lines represent
credit losses less recoveries distributed and as reported to investors during the
period. Net charge-offs for Commercial mortgages represents credit losses less
recoveries distributed and as reported by the trustee for CMBS securitizations.
Realized losses for Agency securitizations are not reflected as we do not manage the
underlying real estate upon foreclosure and, as such, do not have access to loss
information.
V
ARIABLE
I
NTEREST
E
NTITIES
(VIE
S
)
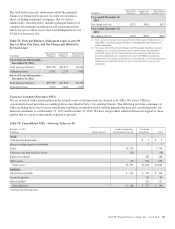
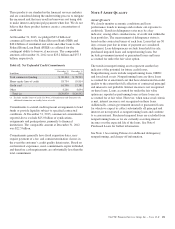
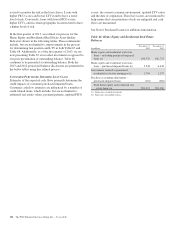
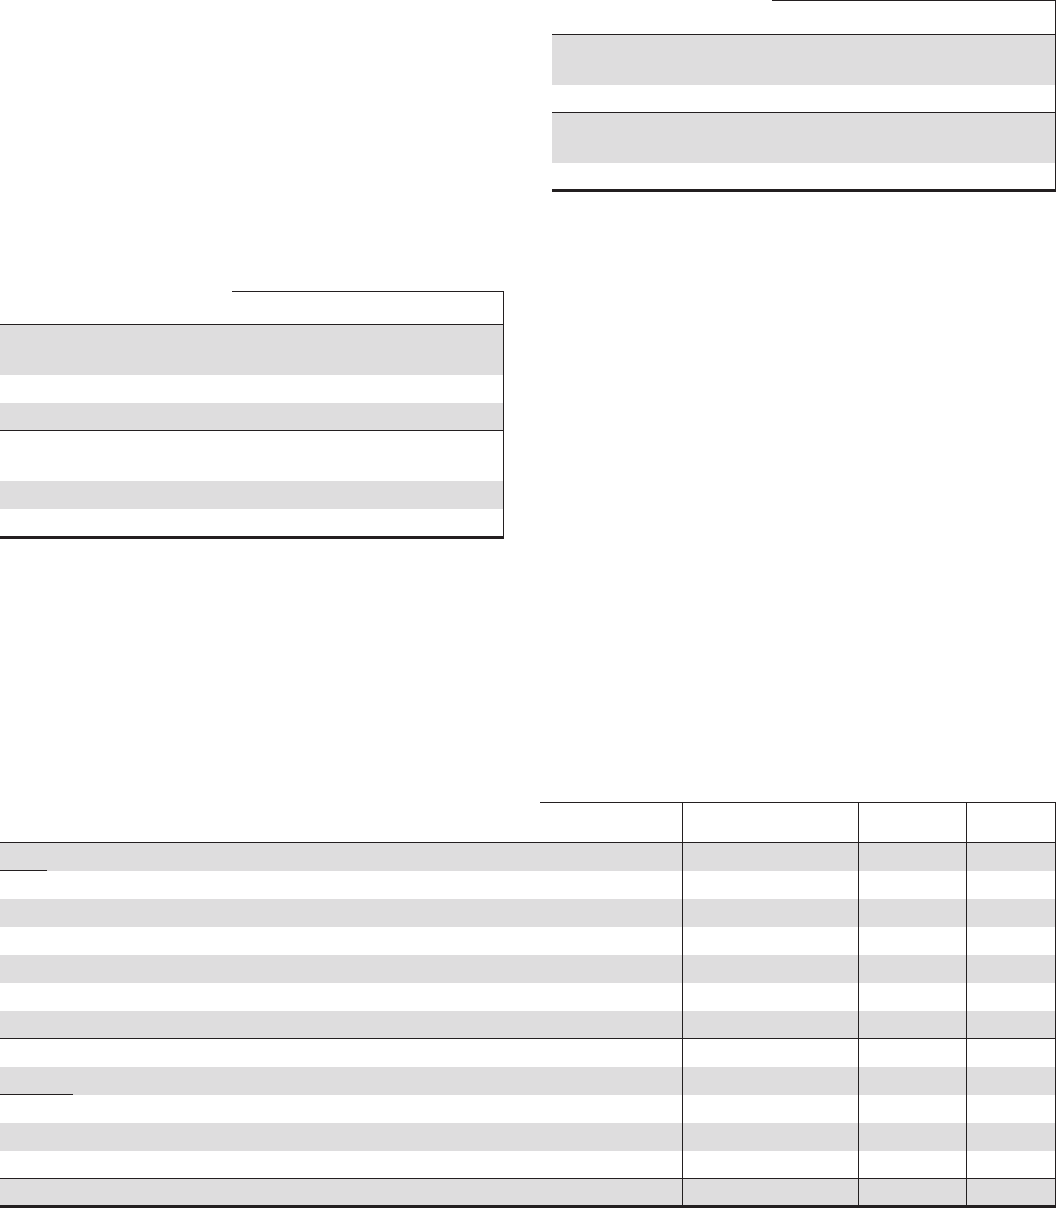
We are involved with various entities in the normal course of business that are deemed to be VIEs. We assess VIEs for
consolidation based upon the accounting policies described in Note 1 Accounting Policies. The following provides a summary of
VIEs, including those that we have consolidated and those in which we hold variable interests but have not consolidated into our
financial statements as of December 31, 2013 and December 31, 2012. We have not provided additional financial support to these
entities that we are not contractually required to provide.
Table 59: Consolidated VIEs – Carrying Value (a) (b)
December 31, 2013 Credit Card and Other Tax Credit
In millions Market Street (c) Securitization Trusts (d) Investments Total
Assets
Cash and due from banks $5 $5
Interest-earning deposits with banks 77
Loans $1,736 1,736
Allowance for loan and lease losses (58) (58)
Equity investments 582 582
Other assets 25 566 591
Total assets $1,703 $1,160 $2,863
Liabilities
Other borrowed funds $ 184 $ 230 $ 414
Accrued expenses 83 83
Other liabilities 252 252
Total liabilities $ 184 $ 565 $ 749
(continued on following page)
The PNC Financial Services Group, Inc. – Form 10-K 127