PNC Bank 2013 Annual Report Download - page 92
Download and view the complete annual report
Please find page 92 of the 2013 PNC Bank annual report below. You can navigate through the pages in the report by either clicking on the pages listed below, or by using the keyword search tool below to find specific information within the annual report.-
 1
1 -
2
-
3
-
4
-
5
-
6
-
7
-
8
-
9
-
10
-
11
-
12
-
13
-
14
-
15
-
16
-
17
-
18
-
19
-
20
-
21
-
22
-
23
-
24
-
25
-
26
-
27
-
28
-
29
-
30
-
31
-
32
-
33
-
34
-
35
-
36
-
37
-
38
-
39
-
40
-
41
-
42
-
43
-
44
-
45
-
46
-
47
-
48
-
49
-
50
-
51
-
52
-
53
-
54
-
55
-
56
-
57
-
58
-
59
-
60
-
61
-
62
-
63
-
64
-
65
-
66
-
67
-
68
-
69
-
70
-
71
-
72
-
73
-
74
-
75
-
76
-
77
-
78
-
79
-
80
-
81
-
 82
82 -
 83
83 -
 84
84 -
 85
85 -
 86
86 -
 87
87 -
 88
88 -
 89
89 -
 90
90 -
 91
91 -
 92
92 -
 93
93 -
 94
94 -
 95
95 -
 96
96 -
 97
97 -
 98
98 -
 99
99 -
 100
100 -
 101
101 -
 102
102 -
103
-
104
-
105
-
106
-
107
-
108
-
109
-
110
-
111
-
112
-
113
-
114
-
115
-
116
-
117
-
118
-
119
-
120
-
121
-
122
-
123
-
124
-
125
-
126
-
127
-
128
-
129
-
130
-
131
-
132
-
133
-
134
-
135
-
136
-
137
-
138
-
139
-
140
-
141
-
142
-
143
-
144
-
145
-
146
-
147
-
148
-
149
-
150
-
151
-
152
-
153
-
154
-
155
-
156
-
157
-
158
-
159
-
160
-
161
-
162
-
163
-
164
-
165
-
166
-
167
-
168
-
169
-
170
-
171
-
172
-
173
-
174
-
175
-
176
-
177
-
178
-
179
-
180
-
181
-
182
-
183
-
184
-
185
-
186
-
187
-
188
-
189
-
190
-
191
-
192
-
193
-
194
-
195
-
196
-
197
-
198
-
199
-
200
-
201
-
202
-
203
-
204
-
205
-
206
-
207
-
208
-
209
-
210
-
211
-
212
-
213
-
214
-
215
-
216
-
217
-
218
-
219
-
220
-
221
-
222
-
223
-
224
-
225
-
226
-
227
-
228
-
229
-
230
-
231
-
232
-
233
-
234
-
235
-
236
-
237
-
238
-
239
-
240
-
241
-
242
-
243
-
244
-
245
-
246
-
247
-
248
-
249
-
250
-
251
-
252
-
253
-
254
-
255
-
256
-
257
-
258
-
259
-
260
-
261
-
262
-
263
-
264
-
265
-
266
 |
 |
N
ONPERFORMING
A
SSETS AND
L
OAN
D
ELINQUENCIES
N
ONPERFORMING
A
SSETS
,
INCLUDING
OREO
AND
F
ORECLOSED
A
SSETS
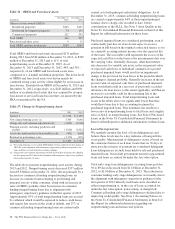
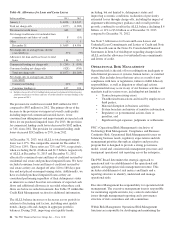
Nonperforming assets include nonperforming loans and leases
for which ultimate collectability of the full amount of
contractual principal and interest is not probable and include
nonperforming troubled debt restructurings (TDRs), OREO
and foreclosed assets. Loans held for sale, certain government
insured or guaranteed loans, purchased impaired loans and
loans accounted for under the fair value option are excluded
from nonperforming loans. Additional information regarding
our nonperforming loans and nonaccrual policies is included
in Note 1 Accounting Policies in the Notes To Consolidated
Financial Statements in Item 8 of this Report. The major
categories of nonperforming assets are presented in Table 35.
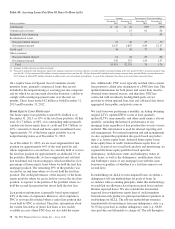
In the first quarter of 2013, we completed our alignment of
certain nonaccrual and charge-off policies consistent with
interagency supervisory guidance on practices for loans and
lines of credit related to consumer lending. This alignment
primarily related to (i) subordinate consumer loans (home
equity loans and lines of credit and residential mortgages)
where the first-lien loan was 90 days or more past due,
(ii) government guaranteed loans where the guarantee may not
result in collection of substantially all contractual principal
and interest and (iii) certain loans with borrowers in or
discharged from bankruptcy. In the first quarter of 2013,
nonperforming loans increased by $426 million and net
charge-offs increased by $134 million as a result of
completing the alignment of the aforementioned policies.
Additionally, overall delinquencies decreased $395 million
due to loans now being reported as either nonperforming or, in
the case of loans accounted for under the fair value option,
nonaccruing or having been charged off. Certain consumer
nonperforming loans were charged-off to the respective
collateral value less costs to sell, and any associated allowance
at the time of charge-off was reduced to zero. Therefore, the
charge-off activity resulted in a reduction to the allowance. As
the interagency guidance was adopted, incremental provision
for credit losses was recorded if the related loan charge-off
exceeded the associated allowance. Consumer provision for
credit losses declined versus prior year as overall
improvement in credit quality, which was favorably impacted
by higher residential real estate prices, more than offset any
increase in provision from the alignment with interagency
guidance. Subsequent declines in collateral value for these
loans will result in additional charge-offs to maintain recorded
investment at collateral value less costs to sell. The impact of
the alignment of the policies was considered in our reserving
process in the determination of our ALLL at December 31,
2012. See Tables 35, 37, 38, 39, 40 and 46 for additional
information.
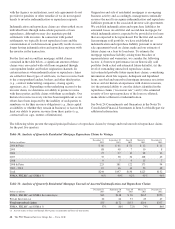
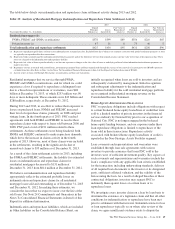
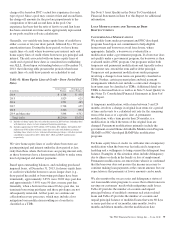
At December 31, 2013, TDRs included in nonperforming
loans were $1.5 billion, or 49%, of total nonperforming loans
compared to $1.6 billion, or 49%, of total nonperforming
loans as of December 31, 2012. Within consumer
nonperforming loans, residential real estate TDRs comprise
59% of total residential real estate nonperforming loans at
December 31, 2013, down from 64% at December 31, 2012.
Home equity TDRs comprise 54% of home equity
nonperforming loans at December 31, 2013, down from 70%
at December 31, 2012. TDRs generally remain in
nonperforming status until a borrower has made at least six
consecutive months of payments under the modified terms or
ultimate resolution occurs. Loans where borrowers have been
discharged from personal liability through Chapter 7
bankruptcy and have not formally reaffirmed their loan
obligations to PNC are not returned to accrual status.
At December 31, 2013, our largest nonperforming asset was
$36 million in the Real Estate, Rental and Leasing Industry
and our average nonperforming loans associated with
commercial lending were under $1 million. Nine of the ten
largest outstanding nonperforming assets are from the
commercial lending portfolio and represent 13% and 4% of
total commercial lending nonperforming loans and total
nonperforming assets, respectively, as of December 31, 2013.
74 The PNC Financial Services Group, Inc. – Form 10-K