PNC Bank 2013 Annual Report Download - page 88
Download and view the complete annual report
Please find page 88 of the 2013 PNC Bank annual report below. You can navigate through the pages in the report by either clicking on the pages listed below, or by using the keyword search tool below to find specific information within the annual report.-
 1
1 -
2
-
3
-
4
-
5
-
6
-
7
-
8
-
9
-
10
-
11
-
12
-
13
-
14
-
15
-
16
-
17
-
18
-
19
-
20
-
21
-
22
-
23
-
24
-
25
-
26
-
27
-
28
-
29
-
30
-
31
-
32
-
33
-
34
-
35
-
36
-
37
-
38
-
39
-
40
-
41
-
42
-
43
-
44
-
45
-
46
-
47
-
48
-
49
-
50
-
51
-
52
-
53
-
54
-
55
-
56
-
57
-
58
-
59
-
60
-
61
-
62
-
63
-
64
-
65
-
66
-
67
-
68
-
69
-
70
-
71
-
72
-
73
-
74
-
75
-
76
-
77
-
 78
78 -
 79
79 -
 80
80 -
 81
81 -
 82
82 -
 83
83 -
 84
84 -
 85
85 -
 86
86 -
 87
87 -
 88
88 -
 89
89 -
 90
90 -
 91
91 -
 92
92 -
 93
93 -
 94
94 -
 95
95 -
 96
96 -
 97
97 -
 98
98 -
99
-
100
-
101
-
102
-
103
-
104
-
105
-
106
-
107
-
108
-
109
-
110
-
111
-
112
-
113
-
114
-
115
-
116
-
117
-
118
-
119
-
120
-
121
-
122
-
123
-
124
-
125
-
126
-
127
-
128
-
129
-
130
-
131
-
132
-
133
-
134
-
135
-
136
-
137
-
138
-
139
-
140
-
141
-
142
-
143
-
144
-
145
-
146
-
147
-
148
-
149
-
150
-
151
-
152
-
153
-
154
-
155
-
156
-
157
-
158
-
159
-
160
-
161
-
162
-
163
-
164
-
165
-
166
-
167
-
168
-
169
-
170
-
171
-
172
-
173
-
174
-
175
-
176
-
177
-
178
-
179
-
180
-
181
-
182
-
183
-
184
-
185
-
186
-
187
-
188
-
189
-
190
-
191
-
192
-
193
-
194
-
195
-
196
-
197
-
198
-
199
-
200
-
201
-
202
-
203
-
204
-
205
-
206
-
207
-
208
-
209
-
210
-
211
-
212
-
213
-
214
-
215
-
216
-
217
-
218
-
219
-
220
-
221
-
222
-
223
-
224
-
225
-
226
-
227
-
228
-
229
-
230
-
231
-
232
-
233
-
234
-
235
-
236
-
237
-
238
-
239
-
240
-
241
-
242
-
243
-
244
-
245
-
246
-
247
-
248
-
249
-
250
-
251
-
252
-
253
-
254
-
255
-
256
-
257
-
258
-
259
-
260
-
261
-
262
-
263
-
264
-
265
-
266
 |
 |

investor’s claim that a breach of a loan covenant and
representation and warranty has occurred, such breach has not
been cured, and the effect of such breach is deemed to have
had a material and adverse effect on the value of the
transferred loan. Depending on the sale agreement and upon
proper notice from the investor, we typically respond to home
equity indemnification and repurchase requests within 60
days, although final resolution of the claim may take a longer
period of time. Most home equity sale agreements do not
provide for penalties or other remedies if we do not respond
timely to investor indemnification or repurchase requests.
Investor indemnification or repurchase claims are typically
settled on an individual loan basis through make-whole
payments or loan repurchases; however, on occasion we may
negotiate pooled settlements with investors. In connection
with pooled settlements, we typically do not repurchase loans
and the consummation of such transactions generally results in
us no longer having indemnification and repurchase exposure
with the investor in the transaction.
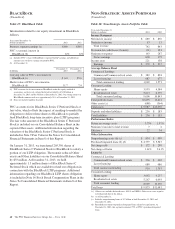
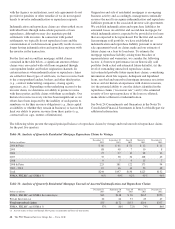
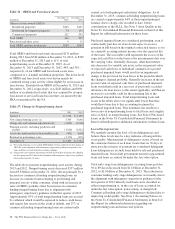
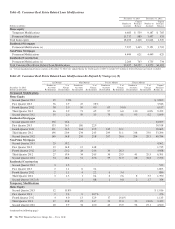
The following table details the unpaid principal balance of our
unresolved home equity indemnification and repurchase
claims at December 31, 2013 and December 31, 2012,
respectively.
Table 33: Analysis of Home Equity Unresolved Asserted
Indemnification and Repurchase Claims
In millions
December 31
2013
December 31
2012
Home equity loans/lines of credit:
Private investors (a) $17 $74
(a) Activity relates to brokered home equity loans/lines of credit sold through loan sale
transactions which occurred during 2005-2007.
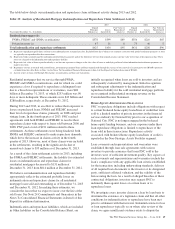
The table below details our home equity indemnification and repurchase claim settlement activity during 2013 and 2012.
Table 34: Analysis of Home Equity Indemnification and Repurchase Claim Settlement Activity
2013 2012
Year ended December 31 – In millions
Unpaid
Principal
Balance (a)
Losses
Incurred (b)
Fair Value of
Repurchased
Loans (c)
Unpaid
Principal
Balance (a)
Losses
Incurred (b)
Fair Value of
Repurchased
Loans (c)
Home equity loans/lines of credit:
Private investors – Repurchases (d) $9 $36 $1 $22 $18 $4
(a) Represents unpaid principal balance of loans at the indemnification or repurchase date. Excluded from these balances are amounts associated with pooled settlement payments as loans
are typically not repurchased in these transactions.
(b) Represents the difference between loan repurchase price and fair value of the loan at the repurchase date. These losses are charged to the indemnification and repurchase liability.
Losses incurred in 2013 also include amounts for settlement payments.
(c) Represents fair value of loans repurchased only as we have no exposure to changes in the fair value of loans or underlying collateral when indemnification/settlement payments are
made to investors.
(d) Activity relates to brokered home equity loans/lines of credit sold through loan sale transactions which occurred during 2005-2007.
During 2013 and 2012, unresolved and settled investor
indemnification and repurchase claims were primarily related to
one of the following alleged breaches in representations and
warranties: (i) misrepresentation of income, assets or
employment, (ii) property evaluation or status issues (e.g.,
appraisal, title, etc.) or (iii) underwriting guideline violations. The
lower balance of unresolved indemnification and repurchase
claims at December 31, 2013 is attributed to settlement activity in
2013. The lower repurchase activity in 2013 was affected by
lower claim activity and lower inventory of claims.
An indemnification and repurchase liability for estimated
losses for which indemnification is expected to be provided or
for loans that are expected to be repurchased was established
at the acquisition of National City. Management’s evaluation
of these indemnification and repurchase liabilities is based
upon trends in indemnification and repurchase claims, actual
loss experience, risks in the underlying serviced loan
portfolios, current economic conditions and the periodic
negotiations that management may enter into with investors to
settle existing and potential future claims.
At December 31, 2013 and December 31, 2012, the liability
for estimated losses on indemnification and repurchase claims
for home equity loans/lines of credit was $22 million and $58
million, respectively. We believe our indemnification and
repurchase liability appropriately reflects the estimated
probable losses on indemnification and repurchase claims for
all home equity loans/lines of credit sold and outstanding as of
December 31, 2013 and December 31, 2012. In making these
estimates, we consider the losses that we expect to incur over
the life of the sold loans. See Note 24 Commitments and
Guarantees in the Notes To Consolidated Financial Statements
in Item 8 of this Report for additional information.
Indemnification and repurchase liabilities, which are included
in Other liabilities on the Consolidated Balance Sheet, are
evaluated by management on a quarterly basis. Initial
recognition and subsequent adjustments to the indemnification
and repurchase liability for home equity loans/lines of credit
are recognized in Other noninterest income on the
Consolidated Income Statement.
70 The PNC Financial Services Group, Inc. – Form 10-K