PNC Bank 2013 Annual Report Download - page 159
Download and view the complete annual report
Please find page 159 of the 2013 PNC Bank annual report below. You can navigate through the pages in the report by either clicking on the pages listed below, or by using the keyword search tool below to find specific information within the annual report.-
 1
1 -
2
-
3
-
4
-
5
-
6
-
7
-
8
-
9
-
10
-
11
-
12
-
13
-
14
-
15
-
16
-
17
-
18
-
19
-
20
-
21
-
22
-
23
-
24
-
25
-
26
-
27
-
28
-
29
-
30
-
31
-
32
-
33
-
34
-
35
-
36
-
37
-
38
-
39
-
40
-
41
-
42
-
43
-
44
-
45
-
46
-
47
-
48
-
49
-
50
-
51
-
52
-
53
-
54
-
55
-
56
-
57
-
58
-
59
-
60
-
61
-
62
-
63
-
64
-
65
-
66
-
67
-
68
-
69
-
70
-
71
-
72
-
73
-
74
-
75
-
76
-
77
-
78
-
79
-
80
-
81
-
82
-
83
-
84
-
85
-
86
-
87
-
88
-
89
-
90
-
91
-
92
-
93
-
94
-
95
-
96
-
97
-
98
-
99
-
100
-
101
-
102
-
103
-
104
-
105
-
106
-
107
-
108
-
109
-
110
-
111
-
112
-
113
-
114
-
115
-
116
-
117
-
118
-
119
-
120
-
121
-
122
-
123
-
124
-
125
-
126
-
127
-
128
-
129
-
130
-
131
-
132
-
133
-
134
-
135
-
136
-
137
-
138
-
139
-
140
-
141
-
142
-
143
-
144
-
145
-
146
-
147
-
148
-
 149
149 -
 150
150 -
 151
151 -
 152
152 -
 153
153 -
 154
154 -
 155
155 -
 156
156 -
 157
157 -
 158
158 -
 159
159 -
 160
160 -
 161
161 -
 162
162 -
 163
163 -
 164
164 -
 165
165 -
 166
166 -
 167
167 -
 168
168 -
 169
169 -
170
-
171
-
172
-
173
-
174
-
175
-
176
-
177
-
178
-
179
-
180
-
181
-
182
-
183
-
184
-
185
-
186
-
187
-
188
-
189
-
190
-
191
-
192
-
193
-
194
-
195
-
196
-
197
-
198
-
199
-
200
-
201
-
202
-
203
-
204
-
205
-
206
-
207
-
208
-
209
-
210
-
211
-
212
-
213
-
214
-
215
-
216
-
217
-
218
-
219
-
220
-
221
-
222
-
223
-
224
-
225
-
226
-
227
-
228
-
229
-
230
-
231
-
232
-
233
-
234
-
235
-
236
-
237
-
238
-
239
-
240
-
241
-
242
-
243
-
244
-
245
-
246
-
247
-
248
-
249
-
250
-
251
-
252
-
253
-
254
-
255
-
256
-
257
-
258
-
259
-
260
-
261
-
262
-
263
-
264
-
265
-
266
 |
 |

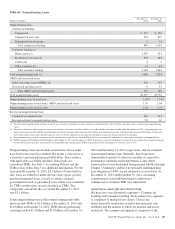
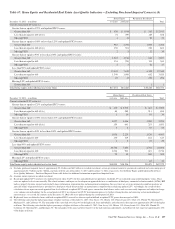
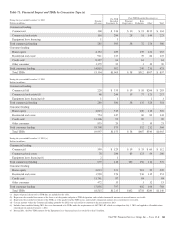
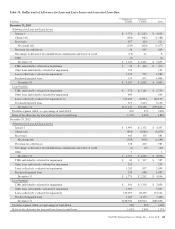
Table 71: Financial Impact and TDRs by Concession Type (a)
During the year ended December 31, 2013 Number
of Loans
Pre-TDR
Recorded
Investment (b)
Post-TDR Recorded Investment (c)
Principal
Forgiveness
Rate
Reduction Other TotalDollars in millions
Commercial lending
Commercial 168 $ 216 $ 10 $ 21 $132 $ 163
Commercial real estate 116 284 28 51 144 223
Equipment lease financing 1 3
Total commercial lending 285 503 38 72 276 386
Consumer lending
Home equity 4,132 289 139 126 265
Residential real estate 911 127 39 86 125
Credit card 8,397 64 61 61
Other consumer 1,379 22 1 19 20
Total consumer lending 14,819 502 240 231 471
Total TDRs 15,104 $1,005 $ 38 $312 $507 $ 857
During the year ended December 31, 2012
Dollars in millions
Commercial lending
Commercial (d) 220 $ 335 $ 19 $ 58 $206 $ 283
Commercial real estate (d) 68 244 19 77 121 217
Equipment lease financing (d) 1 1 1 1
Total commercial lending 289 580 38 135 328 501
Consumer lending
Home equity 4,813 313 200 110 310
Residential real estate 754 147 60 83 143
Credit card 13,306 93 90 90
Other consumer 835 20 2 19 21
Total consumer lending 19,708 573 352 212 564
Total TDRs 19,997 $1,153 $ 38 $487 $540 $1,065
During the year ended December 31, 2011 (e)
Dollars in millions
Commercial lending
Commercial 599 $ 129 $ 19 $ 33 $ 60 $ 112
Commercial real estate 78 286 83 123 54 260
Equipment lease financing (f) 2 1
Total commercial lending 679 416 102 156 114 372
Consumer lending
Home equity 4,013 321 281 39 320
Residential real estate 1,590 376 236 115 351
Credit card 11,761 87 84 84
Other consumer 472 13 1 12 13
Total consumer lending 17,836 797 602 166 768
Total TDRs 18,515 $1,213 $102 $758 $280 $1,140
(a) Impact of partial charge-offs at TDR date are included in this table.
(b) Represents the recorded investment of the loans as of the quarter end prior to TDR designation, and excludes immaterial amounts of accrued interest receivable.
(c) Represents the recorded investment of the TDRs as of the quarter end the TDR occurs, and excludes immaterial amounts of accrued interest receivable.
(d) Certain amounts within the Commercial lending portfolio for 2012 were reclassified to conform to the presentation in 2013.
(e) Includes loans modified during 2011 that were determined to be TDRs under the requirements of ASU 2011-02, which was adopted on July 1, 2011 and applied to all modifications
entered into on and after January 1, 2011.
(f) During 2011, the Post-TDR amounts for the Equipment lease financing loan class totaled less than $1 million.
The PNC Financial Services Group, Inc. – Form 10-K 141