PNC Bank 2013 Annual Report Download - page 187
Download and view the complete annual report
Please find page 187 of the 2013 PNC Bank annual report below. You can navigate through the pages in the report by either clicking on the pages listed below, or by using the keyword search tool below to find specific information within the annual report.-
 1
1 -
2
-
3
-
4
-
5
-
6
-
7
-
8
-
9
-
10
-
11
-
12
-
13
-
14
-
15
-
16
-
17
-
18
-
19
-
20
-
21
-
22
-
23
-
24
-
25
-
26
-
27
-
28
-
29
-
30
-
31
-
32
-
33
-
34
-
35
-
36
-
37
-
38
-
39
-
40
-
41
-
42
-
43
-
44
-
45
-
46
-
47
-
48
-
49
-
50
-
51
-
52
-
53
-
54
-
55
-
56
-
57
-
58
-
59
-
60
-
61
-
62
-
63
-
64
-
65
-
66
-
67
-
68
-
69
-
70
-
71
-
72
-
73
-
74
-
75
-
76
-
77
-
78
-
79
-
80
-
81
-
82
-
83
-
84
-
85
-
86
-
87
-
88
-
89
-
90
-
91
-
92
-
93
-
94
-
95
-
96
-
97
-
98
-
99
-
100
-
101
-
102
-
103
-
104
-
105
-
106
-
107
-
108
-
109
-
110
-
111
-
112
-
113
-
114
-
115
-
116
-
117
-
118
-
119
-
120
-
121
-
122
-
123
-
124
-
125
-
126
-
127
-
128
-
129
-
130
-
131
-
132
-
133
-
134
-
135
-
136
-
137
-
138
-
139
-
140
-
141
-
142
-
143
-
144
-
145
-
146
-
147
-
148
-
149
-
150
-
151
-
152
-
153
-
154
-
155
-
156
-
157
-
158
-
159
-
160
-
161
-
162
-
163
-
164
-
165
-
166
-
167
-
168
-
169
-
170
-
171
-
172
-
173
-
174
-
175
-
176
-
 177
177 -
 178
178 -
 179
179 -
 180
180 -
 181
181 -
 182
182 -
 183
183 -
 184
184 -
 185
185 -
 186
186 -
 187
187 -
 188
188 -
 189
189 -
 190
190 -
 191
191 -
 192
192 -
 193
193 -
 194
194 -
 195
195 -
 196
196 -
 197
197 -
198
-
199
-
200
-
201
-
202
-
203
-
204
-
205
-
206
-
207
-
208
-
209
-
210
-
211
-
212
-
213
-
214
-
215
-
216
-
217
-
218
-
219
-
220
-
221
-
222
-
223
-
224
-
225
-
226
-
227
-
228
-
229
-
230
-
231
-
232
-
233
-
234
-
235
-
236
-
237
-
238
-
239
-
240
-
241
-
242
-
243
-
244
-
245
-
246
-
247
-
248
-
249
-
250
-
251
-
252
-
253
-
254
-
255
-
256
-
257
-
258
-
259
-
260
-
261
-
262
-
263
-
264
-
265
-
266
 |
 |

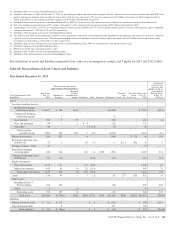
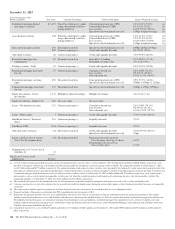
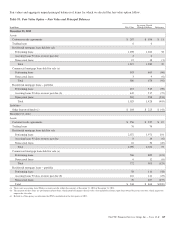
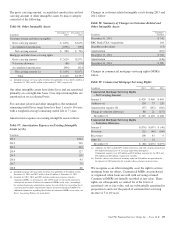
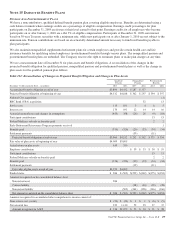
Fair values and aggregate unpaid principal balances of items for which we elected the fair value option follow.
Table 93: Fair Value Option – Fair Value and Principal Balances
In millions Fair Value
Aggregate Unpaid
Principal Balance Difference
December 31, 2013
Assets
Customer resale agreements $ 207 $ 196 $ 11
Trading loans 66
Residential mortgage loans held for sale
Performing loans 1,298 1,260 38
Accruing loans 90 days or more past due 2 2
Nonaccrual loans 15 18 (3)
Total 1,315 1,280 35
Commercial mortgage loans held for sale (a)
Performing loans 583 669 (86)
Nonaccrual loans 3 9 (6)
Total 586 678 (92)
Residential mortgage loans – portfolio
Performing loans 215 313 (98)
Accruing loans 90 days or more past due (b) 445 517 (72)
Nonaccrual loans 365 598 (233)
Total 1,025 1,428 (403)
Liabilities
Other borrowed funds (c) $ 184 $ 225 $ (41)
December 31, 2012
Assets
Customer resale agreements $ 256 $ 237 $ 19
Trading loans 76 76
Residential mortgage loans held for sale
Performing loans 2,072 1,971 101
Accruing loans 90 days or more past due 8 14 (6)
Nonaccrual loans 16 36 (20)
Total 2,096 2,021 75
Commercial mortgage loans held for sale (a)
Performing loans 766 889 (123)
Nonaccrual loans 6 12 (6)
Total 772 901 (129)
Residential mortgage loans – portfolio
Performing loans 58 116 (58)
Accruing loans 90 days or more past due (b) 116 141 (25)
Nonaccrual loans 70 207 (137)
Total $ 244 $ 464 $(220)
(a) There were no accruing loans 90 days or more past due within this category at December 31, 2013 or December 31, 2012.
(b) The majority of these loans are government insured loans, which positively impacts the fair value. Also included are home equity loans owned by private investors, which negatively
impacts the fair value.
(c) Related to a Non-agency securitization that PNC consolidated in the first quarter of 2013.
The PNC Financial Services Group, Inc. – Form 10-K 169