PNC Bank 2013 Annual Report Download - page 172
Download and view the complete annual report
Please find page 172 of the 2013 PNC Bank annual report below. You can navigate through the pages in the report by either clicking on the pages listed below, or by using the keyword search tool below to find specific information within the annual report.-
 1
1 -
2
-
3
-
4
-
5
-
6
-
7
-
8
-
9
-
10
-
11
-
12
-
13
-
14
-
15
-
16
-
17
-
18
-
19
-
20
-
21
-
22
-
23
-
24
-
25
-
26
-
27
-
28
-
29
-
30
-
31
-
32
-
33
-
34
-
35
-
36
-
37
-
38
-
39
-
40
-
41
-
42
-
43
-
44
-
45
-
46
-
47
-
48
-
49
-
50
-
51
-
52
-
53
-
54
-
55
-
56
-
57
-
58
-
59
-
60
-
61
-
62
-
63
-
64
-
65
-
66
-
67
-
68
-
69
-
70
-
71
-
72
-
73
-
74
-
75
-
76
-
77
-
78
-
79
-
80
-
81
-
82
-
83
-
84
-
85
-
86
-
87
-
88
-
89
-
90
-
91
-
92
-
93
-
94
-
95
-
96
-
97
-
98
-
99
-
100
-
101
-
102
-
103
-
104
-
105
-
106
-
107
-
108
-
109
-
110
-
111
-
112
-
113
-
114
-
115
-
116
-
117
-
118
-
119
-
120
-
121
-
122
-
123
-
124
-
125
-
126
-
127
-
128
-
129
-
130
-
131
-
132
-
133
-
134
-
135
-
136
-
137
-
138
-
139
-
140
-
141
-
142
-
143
-
144
-
145
-
146
-
147
-
148
-
149
-
150
-
151
-
152
-
153
-
154
-
155
-
156
-
157
-
158
-
159
-
160
-
161
-
 162
162 -
 163
163 -
 164
164 -
 165
165 -
 166
166 -
 167
167 -
 168
168 -
 169
169 -
 170
170 -
 171
171 -
 172
172 -
 173
173 -
 174
174 -
 175
175 -
 176
176 -
 177
177 -
 178
178 -
 179
179 -
 180
180 -
 181
181 -
 182
182 -
183
-
184
-
185
-
186
-
187
-
188
-
189
-
190
-
191
-
192
-
193
-
194
-
195
-
196
-
197
-
198
-
199
-
200
-
201
-
202
-
203
-
204
-
205
-
206
-
207
-
208
-
209
-
210
-
211
-
212
-
213
-
214
-
215
-
216
-
217
-
218
-
219
-
220
-
221
-
222
-
223
-
224
-
225
-
226
-
227
-
228
-
229
-
230
-
231
-
232
-
233
-
234
-
235
-
236
-
237
-
238
-
239
-
240
-
241
-
242
-
243
-
244
-
245
-
246
-
247
-
248
-
249
-
250
-
251
-
252
-
253
-
254
-
255
-
256
-
257
-
258
-
259
-
260
-
261
-
262
-
263
-
264
-
265
-
266
 |
 |

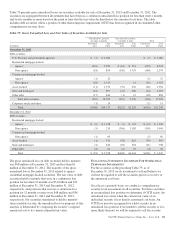
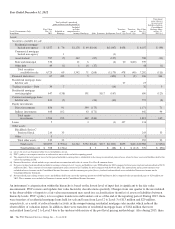
Based on current interest rates and expected prepayment
speeds, the weighted-average expected maturity of the
investment securities portfolio (excluding corporate stocks
and other) was 4.9 years at December 31, 2013 and 4.0 years
at December 31, 2012. The weighted-average expected
maturity of mortgage and other asset-backed debt securities
were as follows as of December 31, 2013:
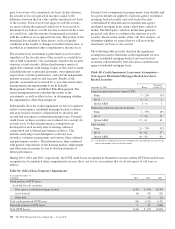
Table 85: Weighted-Average Expected Maturity of Mortgage
and Other Asset-Backed Debt Securities
December 31, 2013 Years
Agency residential mortgage-backed securities 5.0
Non-agency residential mortgage-backed securities 5.8
Agency commercial mortgage-backed securities 3.9
Non-agency commercial mortgage-backed securities 3.0
Asset-backed securities 3.6
Weighted-average yields are based on historical cost with
effective yields weighted for the contractual maturity of each
security. At December 31, 2013, there were no securities of a
single issuer, other than FNMA, that exceeded 10% of Total
shareholders’ equity.
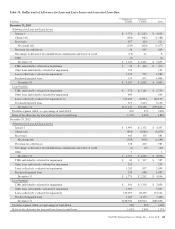
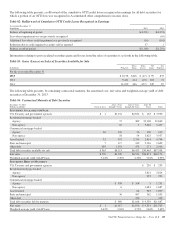
The following table presents the fair value of securities that
have been either pledged to or accepted from others to
collateralize outstanding borrowings.
Table 86: Fair Value of Securities Pledged and Accepted as
Collateral
In millions
December 31
2013
December 31
2012
Pledged to others $18,772 $25,648
Accepted from others:
Permitted by contract or custom to sell
or repledge 1,571 1,015
Permitted amount repledged to others 1,343 685
The securities pledged to others include positions held in our
portfolio of investment securities, trading securities, and
securities accepted as collateral from others that we are
permitted by contract or custom to sell or repledge, and were
used to secure public and trust deposits, repurchase
agreements, and for other purposes. Total securities pledged to
others decreased due primarily to the issuance of $6.2 billion
in standby letters of credit on our behalf by the FHLB-
Pittsburgh to secure certain public deposits previously
collateralized with securities.
N
OTE
9F
AIR
V
ALUE
F
AIR
V
ALUE
M
EASUREMENT
Fair value is defined in GAAP as the price that would be
received to sell an asset or the price that would be paid to
transfer a liability on the measurement date. GAAP focuses on
the exit price in the principal or most advantageous market for
the asset or liability in an orderly transaction between market
participants. GAAP establishes a fair value reporting
hierarchy to maximize the use of observable inputs when
measuring fair value and defines the three levels of inputs as
noted below.
Level 1
Fair value is determined using a quoted price in an active
market for identical assets or liabilities. Level 1 assets and
liabilities may include debt securities, equity securities and
listed derivative contracts that are traded in an active exchange
market and certain U.S. Treasury securities that are actively
traded in over-the-counter markets.
Level 2
Fair value is estimated using inputs other than quoted prices
included within Level 1 that are observable for assets or
liabilities, either directly or indirectly. Level 2 assets and
liabilities may include debt securities, equity securities and
listed derivative contracts with quoted prices that are traded in
markets that are not active, and certain debt and equity
securities and over-the-counter derivative contracts whose fair
value is determined using a pricing model without significant
unobservable inputs.
Level 3
Fair value is estimated using unobservable inputs that are
significant to the fair value of the assets or liabilities. Level 3
assets and liabilities may include financial instruments whose
value is determined using pricing services, pricing models
with internally developed assumptions, discounted cash flow
methodologies, or similar techniques, as well as other
instruments for which the determination of fair value requires
significant management judgment or estimation.
Certain assets which have been adjusted due to impairment are
accounted for at either fair value or lower of amortized cost or
fair value on a nonrecurring basis and consist primarily of
certain nonaccrual loans, loans held for sale, commercial
mortgage servicing rights, equity investments and other assets.
These assets which are generally classified as Level 3 are
included in Table 90 in this Note 9.
We characterize active markets as those where transaction
volumes are sufficient to provide objective pricing
information, with reasonably narrow bid/ask spreads and
where dealer quotes received do not vary widely and are based
on current information. Inactive markets are typically
characterized by low transaction volumes, price quotations
that vary substantially among market participants or are not
based on current information, wide bid/ask spreads, a
154 The PNC Financial Services Group, Inc. – Form 10-K