PNC Bank 2013 Annual Report Download - page 58
Download and view the complete annual report
Please find page 58 of the 2013 PNC Bank annual report below. You can navigate through the pages in the report by either clicking on the pages listed below, or by using the keyword search tool below to find specific information within the annual report.-
 1
1 -
2
-
3
-
4
-
5
-
6
-
7
-
8
-
9
-
10
-
11
-
12
-
13
-
14
-
15
-
16
-
17
-
18
-
19
-
20
-
21
-
22
-
23
-
24
-
25
-
26
-
27
-
28
-
29
-
30
-
31
-
32
-
33
-
34
-
35
-
36
-
37
-
38
-
39
-
40
-
41
-
42
-
43
-
44
-
45
-
46
-
47
-
 48
48 -
 49
49 -
 50
50 -
 51
51 -
 52
52 -
 53
53 -
 54
54 -
 55
55 -
 56
56 -
 57
57 -
 58
58 -
 59
59 -
 60
60 -
 61
61 -
 62
62 -
 63
63 -
 64
64 -
 65
65 -
 66
66 -
 67
67 -
 68
68 -
69
-
70
-
71
-
72
-
73
-
74
-
75
-
76
-
77
-
78
-
79
-
80
-
81
-
82
-
83
-
84
-
85
-
86
-
87
-
88
-
89
-
90
-
91
-
92
-
93
-
94
-
95
-
96
-
97
-
98
-
99
-
100
-
101
-
102
-
103
-
104
-
105
-
106
-
107
-
108
-
109
-
110
-
111
-
112
-
113
-
114
-
115
-
116
-
117
-
118
-
119
-
120
-
121
-
122
-
123
-
124
-
125
-
126
-
127
-
128
-
129
-
130
-
131
-
132
-
133
-
134
-
135
-
136
-
137
-
138
-
139
-
140
-
141
-
142
-
143
-
144
-
145
-
146
-
147
-
148
-
149
-
150
-
151
-
152
-
153
-
154
-
155
-
156
-
157
-
158
-
159
-
160
-
161
-
162
-
163
-
164
-
165
-
166
-
167
-
168
-
169
-
170
-
171
-
172
-
173
-
174
-
175
-
176
-
177
-
178
-
179
-
180
-
181
-
182
-
183
-
184
-
185
-
186
-
187
-
188
-
189
-
190
-
191
-
192
-
193
-
194
-
195
-
196
-
197
-
198
-
199
-
200
-
201
-
202
-
203
-
204
-
205
-
206
-
207
-
208
-
209
-
210
-
211
-
212
-
213
-
214
-
215
-
216
-
217
-
218
-
219
-
220
-
221
-
222
-
223
-
224
-
225
-
226
-
227
-
228
-
229
-
230
-
231
-
232
-
233
-
234
-
235
-
236
-
237
-
238
-
239
-
240
-
241
-
242
-
243
-
244
-
245
-
246
-
247
-
248
-
249
-
250
-
251
-
252
-
253
-
254
-
255
-
256
-
257
-
258
-
259
-
260
-
261
-
262
-
263
-
264
-
265
-
266
 |
 |
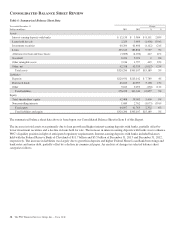
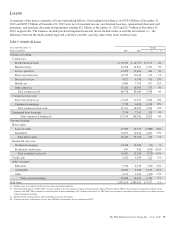
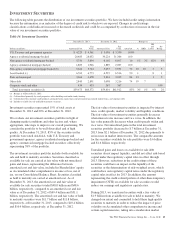
The increase in loans was driven by the increase in
commercial lending as a result of growth in commercial and
commercial real estate loans, primarily from new customers
and organic growth. The increase in consumer lending
resulted from growth in automobile loans, partially offset by
paydowns of education loans.
Loans represented 61% of total assets at both December 31,
2013 and December 31, 2012. Commercial lending
represented 60% of the loan portfolio at December 31, 2013
and 59% at December 31, 2012. Consumer lending
represented 40% of the loan portfolio at December 31, 2013
and 41% at December 31, 2012.
Commercial real estate loans represented 11% of total loans at
December 31, 2013 and 10% at December 31, 2012 and
represented 7% of total assets at December 31, 2013 and 6%
at December 31, 2012. See the Credit Risk Management
portion of the Risk Management section of this Item 7 for
additional information regarding our loan portfolio.
Total loans above include purchased impaired loans of $6.1
billion, or 3% of total loans, at December 31, 2013, and $7.4
billion, or 4% of total loans, at December 31, 2012.
Our loan portfolio continued to be diversified among
numerous industries, types of businesses and consumers
across our principal geographic markets.
A
LLOWANCE FOR
L
OAN AND
L
EASE
L
OSSES
(ALLL)
Our total ALLL of $3.6 billion at December 31, 2013
consisted of $1.5 billion and $2.1 billion established for the
commercial lending and consumer lending categories,
respectively. The ALLL included what we believe to be
appropriate loss coverage on all loans, including higher risk
loans, in the commercial and consumer portfolios. We do not
consider government insured or guaranteed loans to be higher
risk as defaults have historically been materially mitigated by
payments of insurance or guarantee amounts for approved
claims. Additional information regarding our higher risk loans
is included in the Credit Risk Management portion of the Risk
Management section of this Item 7 and Note 5 Asset Quality
and Note 7 Allowances for Loan and Lease Losses and
Unfunded Loan Commitments and Letters of Credit in our
Notes To Consolidated Financial Statements included in
Item 8 of this Report.
P
URCHASE
A
CCOUNTING
A
CCRETION AND
V
ALUATION OF
P
URCHASED
I
MPAIRED
L
OANS
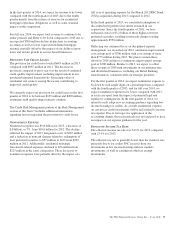
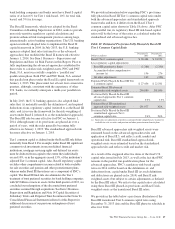
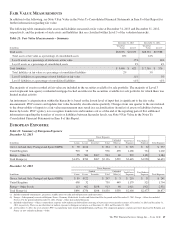
Information related to purchase accounting accretion and
accretable yield for 2013 and 2012 follows. Additional
information is provided in Note 6 Purchased Loans in the
Notes To Consolidated Financial Statements of this Report.
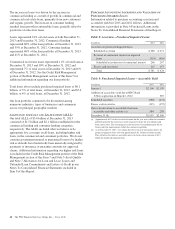
Table 8: Accretion – Purchased Impaired Loans
In millions 2013 2012
Accretion on purchased impaired loans
Scheduled accretion $ 580 $ 671
Reversal of contractual interest on impaired
loans (314) (404)
Scheduled accretion net of contractual interest 266 267
Excess cash recoveries 115 157
Total $ 381 $ 424
Table 9: Purchased Impaired Loans – Accretable Yield
In millions 2013 2012
January 1 $2,166 $2,109
Addition of accretable yield due to RBC Bank
(USA) acquisition on March 2, 2012 587
Scheduled accretion (580) (671)
Excess cash recoveries (115) (157)
Net reclassifications to accretable from non-
accretable and other activity (a) 584 298
December 31 (b) $2,055 $2,166
(a) Approximately 63% of the net reclassifications for the year were within the consumer
portfolio primarily due to increases in the expected average life of residential and
home equity loans. The remaining net reclassifications were predominantly due to
future cash flow improvements within the commercial portfolio.
(b) As of December 31, 2013, we estimate that the reversal of contractual interest on
purchased impaired loans will total approximately $1.1 billion in future periods.
This will offset the total net accretable interest in future interest income of $2.1
billion on purchased impaired loans.
40 The PNC Financial Services Group, Inc. – Form 10-K