PNC Bank 2013 Annual Report Download - page 236
Download and view the complete annual report
Please find page 236 of the 2013 PNC Bank annual report below. You can navigate through the pages in the report by either clicking on the pages listed below, or by using the keyword search tool below to find specific information within the annual report.-
 1
1 -
2
-
3
-
4
-
5
-
6
-
7
-
8
-
9
-
10
-
11
-
12
-
13
-
14
-
15
-
16
-
17
-
18
-
19
-
20
-
21
-
22
-
23
-
24
-
25
-
26
-
27
-
28
-
29
-
30
-
31
-
32
-
33
-
34
-
35
-
36
-
37
-
38
-
39
-
40
-
41
-
42
-
43
-
44
-
45
-
46
-
47
-
48
-
49
-
50
-
51
-
52
-
53
-
54
-
55
-
56
-
57
-
58
-
59
-
60
-
61
-
62
-
63
-
64
-
65
-
66
-
67
-
68
-
69
-
70
-
71
-
72
-
73
-
74
-
75
-
76
-
77
-
78
-
79
-
80
-
81
-
82
-
83
-
84
-
85
-
86
-
87
-
88
-
89
-
90
-
91
-
92
-
93
-
94
-
95
-
96
-
97
-
98
-
99
-
100
-
101
-
102
-
103
-
104
-
105
-
106
-
107
-
108
-
109
-
110
-
111
-
112
-
113
-
114
-
115
-
116
-
117
-
118
-
119
-
120
-
121
-
122
-
123
-
124
-
125
-
126
-
127
-
128
-
129
-
130
-
131
-
132
-
133
-
134
-
135
-
136
-
137
-
138
-
139
-
140
-
141
-
142
-
143
-
144
-
145
-
146
-
147
-
148
-
149
-
150
-
151
-
152
-
153
-
154
-
155
-
156
-
157
-
158
-
159
-
160
-
161
-
162
-
163
-
164
-
165
-
166
-
167
-
168
-
169
-
170
-
171
-
172
-
173
-
174
-
175
-
176
-
177
-
178
-
179
-
180
-
181
-
182
-
183
-
184
-
185
-
186
-
187
-
188
-
189
-
190
-
191
-
192
-
193
-
194
-
195
-
196
-
197
-
198
-
199
-
200
-
201
-
202
-
203
-
204
-
205
-
206
-
207
-
208
-
209
-
210
-
211
-
212
-
213
-
214
-
215
-
216
-
217
-
218
-
219
-
220
-
221
-
222
-
223
-
224
-
225
-
 226
226 -
 227
227 -
 228
228 -
 229
229 -
 230
230 -
 231
231 -
 232
232 -
 233
233 -
 234
234 -
 235
235 -
 236
236 -
 237
237 -
 238
238 -
 239
239 -
 240
240 -
 241
241 -
 242
242 -
 243
243 -
 244
244 -
 245
245 -
 246
246 -
247
-
248
-
249
-
250
-
251
-
252
-
253
-
254
-
255
-
256
-
257
-
258
-
259
-
260
-
261
-
262
-
263
-
264
-
265
-
266
 |
 |

N
OTE
25 P
ARENT
C
OMPANY
Summarized financial information of the parent company is as
follows:
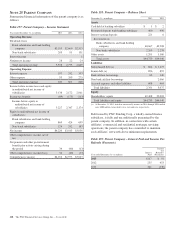
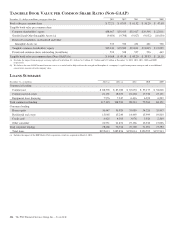
Table 157: Parent Company – Income Statement
Year ended December 31– in millions 2013 2012 2011
Operating Revenue
Dividends from:
Bank subsidiaries and bank holding
company $3,105 $2,660 $2,513
Non-bank subsidiaries 205 91 131
Interest income 1
Noninterest income 28 22 24
Total operating revenue 3,338 2,773 2,669
Operating Expense
Interest expense 107 242 333
Other expense 93 359 275
Total operating expense 200 601 608
Income before income taxes and equity
in undistributed net income of
subsidiaries 3,138 2,172 2,061
Income tax benefits (89) (175) (113)
Income before equity in
undistributed net income of
subsidiaries 3,227 2,347 2,174
Equity in undistributed net income of
subsidiaries:
Bank subsidiaries and bank holding
company 869 424 699
Non-bank subsidiaries 124 242 183
Net income $4,220 $3,013 $3,056
Other comprehensive income, net of
tax:
Net pension and other postretirement
benefit plan activity arising during
the period 34 (40) (13)
Other comprehensive income (loss) 34 (40) (13)
Comprehensive income $4,254 $2,973 $3,043
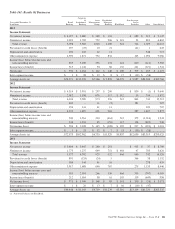
Table 158: Parent Company – Balance Sheet
December 31– in millions 2013 2012
Assets
Cash held at banking subsidiary $ 1 $ 2
Restricted deposits with banking subsidiary 400 400
Interest-earning deposits 221 6
Investments in:
Bank subsidiaries and bank holding
company 40,667 40,208
Non-bank subsidiaries 2,269 2,238
Other assets 1,201 1,186
Total assets $44,759 $44,040
Liabilities
Subordinated debt (a) $ 824 $ 1,275
Senior debt (a) 856 892
Bank affiliate borrowings 63 140
Non-bank affiliate borrowings 2,066
Accrued expenses and other liabilities 608 664
Total liabilities 2,351 5,037
Equity
Shareholders’ equity 42,408 39,003
Total liabilities and equity $44,759 $44,040
(a) At December 31, 2013, debt that contractually matures in 2014 through 2018 totaled
zero, $400 million (senior debt), zero, zero and zero, respectively.
Debt issued by PNC Funding Corp, a wholly-owned finance
subsidiary, is fully and unconditionally guaranteed by the
parent company. In addition, in connection with certain
affiliates’ commercial and residential mortgage servicing
operations, the parent company has committed to maintain
such affiliates’ net worth above minimum requirements.
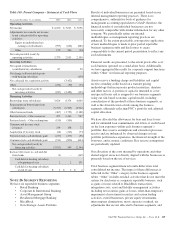
Table 159: Parent Company – Interest Paid and Income Tax
Refunds (Payments)
Year ended December 31– in millions
Interest
Paid
Income
Tax
Refunds /
(Payments)
2013 $117 $ 91
2012 255 453
2011 361 (130)
218 The PNC Financial Services Group, Inc. – Form 10-K