PNC Bank 2013 Annual Report Download - page 170
Download and view the complete annual report
Please find page 170 of the 2013 PNC Bank annual report below. You can navigate through the pages in the report by either clicking on the pages listed below, or by using the keyword search tool below to find specific information within the annual report.-
 1
1 -
2
-
3
-
4
-
5
-
6
-
7
-
8
-
9
-
10
-
11
-
12
-
13
-
14
-
15
-
16
-
17
-
18
-
19
-
20
-
21
-
22
-
23
-
24
-
25
-
26
-
27
-
28
-
29
-
30
-
31
-
32
-
33
-
34
-
35
-
36
-
37
-
38
-
39
-
40
-
41
-
42
-
43
-
44
-
45
-
46
-
47
-
48
-
49
-
50
-
51
-
52
-
53
-
54
-
55
-
56
-
57
-
58
-
59
-
60
-
61
-
62
-
63
-
64
-
65
-
66
-
67
-
68
-
69
-
70
-
71
-
72
-
73
-
74
-
75
-
76
-
77
-
78
-
79
-
80
-
81
-
82
-
83
-
84
-
85
-
86
-
87
-
88
-
89
-
90
-
91
-
92
-
93
-
94
-
95
-
96
-
97
-
98
-
99
-
100
-
101
-
102
-
103
-
104
-
105
-
106
-
107
-
108
-
109
-
110
-
111
-
112
-
113
-
114
-
115
-
116
-
117
-
118
-
119
-
120
-
121
-
122
-
123
-
124
-
125
-
126
-
127
-
128
-
129
-
130
-
131
-
132
-
133
-
134
-
135
-
136
-
137
-
138
-
139
-
140
-
141
-
142
-
143
-
144
-
145
-
146
-
147
-
148
-
149
-
150
-
151
-
152
-
153
-
154
-
155
-
156
-
157
-
158
-
159
-
 160
160 -
 161
161 -
 162
162 -
 163
163 -
 164
164 -
 165
165 -
 166
166 -
 167
167 -
 168
168 -
 169
169 -
 170
170 -
 171
171 -
 172
172 -
 173
173 -
 174
174 -
 175
175 -
 176
176 -
 177
177 -
 178
178 -
 179
179 -
 180
180 -
181
-
182
-
183
-
184
-
185
-
186
-
187
-
188
-
189
-
190
-
191
-
192
-
193
-
194
-
195
-
196
-
197
-
198
-
199
-
200
-
201
-
202
-
203
-
204
-
205
-
206
-
207
-
208
-
209
-
210
-
211
-
212
-
213
-
214
-
215
-
216
-
217
-
218
-
219
-
220
-
221
-
222
-
223
-
224
-
225
-
226
-
227
-
228
-
229
-
230
-
231
-
232
-
233
-
234
-
235
-
236
-
237
-
238
-
239
-
240
-
241
-
242
-
243
-
244
-
245
-
246
-
247
-
248
-
249
-
250
-
251
-
252
-
253
-
254
-
255
-
256
-
257
-
258
-
259
-
260
-
261
-
262
-
263
-
264
-
265
-
266
 |
 |

prior to recovery of its amortized cost basis. In this situation,
the amount of loss recognized in income is equal to the
difference between the fair value and the amortized cost basis
of the security. Even if we do not expect to sell the security,
we must evaluate the expected cash flows to be received to
determine if we believe a credit loss has occurred. In the event
of a credit loss, only the amount of impairment associated
with the credit loss is recognized in income. The portion of the
unrealized loss relating to other factors, such as liquidity
conditions in the market or changes in market interest rates, is
recorded in accumulated other comprehensive income (loss).
The security-level assessment is performed on each security,
regardless of the classification of the security as available for
sale or held to maturity. Our assessment considers the security
structure, recent security collateral performance metrics if
applicable, external credit ratings, failure of the issuer to make
scheduled interest or principal payments, our judgment and
expectations of future performance, and relevant independent
industry research, analysis and forecasts. Results of the
periodic assessment are reviewed by a cross-functional senior
management team representing Asset & Liability
Management, Finance, and Market Risk Management. The
senior management team considers the results of the
assessments, as well as other factors, in determining whether
the impairment is other-than-temporary.
Substantially all of the credit impairment we have recognized
relates to non-agency residential mortgage-backed securities
and asset-backed securities collateralized by first-lien and
second-lien non-agency residential mortgage loans. Potential
credit losses on these securities are evaluated on a security-by-
security basis. Collateral performance assumptions are
developed for each security after reviewing collateral
composition and collateral performance statistics. This
includes analyzing recent delinquency roll rates, loss
severities, voluntary prepayments and various other collateral
and performance metrics. This information is then combined
with general expectations on the housing market, employment
and other macroeconomic factors to develop estimates of
future performance.
Security level assumptions for prepayments, loan defaults and
loss given default are applied to each non-agency residential
mortgage-backed security and asset-backed security
collateralized by first-lien and second-lien non-agency
residential mortgage loans using a third-party cash flow
model. The third-party cash flow model then generates
projected cash flows according to the structure of each
security. Based on the results of the cash flow analysis, we
determine whether we expect that we will recover the
amortized cost basis of our security.
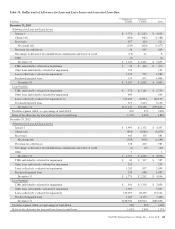
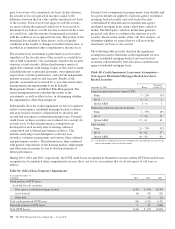
The following table provides detail on the significant
assumptions used to determine credit impairment for non-
agency residential mortgage-backed and asset-backed
securities collateralized by first-lien and second-lien non-
agency residential mortgage loans.
Table 80: Credit Impairment Assessment Assumptions –
Non-Agency Residential Mortgage-Backed and Asset-
Backed Securities
December 31, 2013 Range
Weighted-
average (a)
Long-term prepayment rate (annual CPR)
Prime 7 – 20% 13%
Alt-A 5 – 12 6
Option ARM 3 – 6 3
Remaining collateral expected to default
Prime 1 – 39% 15%
Alt-A 7 – 56 31
Option ARM 17 – 61 42
Loss severity
Prime 25 – 70% 42%
Alt-A 30 – 82 57
Option ARM 40 – 80 60
(a) Calculated by weighting the relevant assumption for each individual security by the
current outstanding cost basis of the security.
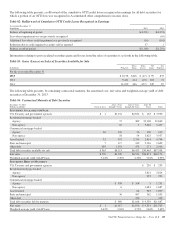
During 2013, 2012 and 2011, respectively, the OTTI credit losses recognized in Noninterest income and the OTTI noncredit losses
recognized in Accumulated other comprehensive income (loss), net of tax, on securities that we do not expect to sell were as
follows:
Table 81: Other-Than-Temporary Impairments
Year ended December 31
In millions 2013 2012 2011
Credit portion of OTTI losses
Available for sale securities:
Non-agency residential mortgage-backed $(10) $ (99) $(130)
Asset-backed (6) (11) (21)
Other debt (1) (1)
Total credit portion of OTTI losses (16) (111) (152)
Noncredit portion of OTTI losses 2 32 (268)
Total OTTI Losses $(14) $ (79) $(420)
152 The PNC Financial Services Group, Inc. – Form 10-K