PNC Bank 2013 Annual Report Download - page 64
Download and view the complete annual report
Please find page 64 of the 2013 PNC Bank annual report below. You can navigate through the pages in the report by either clicking on the pages listed below, or by using the keyword search tool below to find specific information within the annual report.-
 1
1 -
2
-
3
-
4
-
5
-
6
-
7
-
8
-
9
-
10
-
11
-
12
-
13
-
14
-
15
-
16
-
17
-
18
-
19
-
20
-
21
-
22
-
23
-
24
-
25
-
26
-
27
-
28
-
29
-
30
-
31
-
32
-
33
-
34
-
35
-
36
-
37
-
38
-
39
-
40
-
41
-
42
-
43
-
44
-
45
-
46
-
47
-
48
-
49
-
50
-
51
-
52
-
53
-
 54
54 -
 55
55 -
 56
56 -
 57
57 -
 58
58 -
 59
59 -
 60
60 -
 61
61 -
 62
62 -
 63
63 -
 64
64 -
 65
65 -
 66
66 -
 67
67 -
 68
68 -
 69
69 -
 70
70 -
 71
71 -
 72
72 -
 73
73 -
 74
74 -
75
-
76
-
77
-
78
-
79
-
80
-
81
-
82
-
83
-
84
-
85
-
86
-
87
-
88
-
89
-
90
-
91
-
92
-
93
-
94
-
95
-
96
-
97
-
98
-
99
-
100
-
101
-
102
-
103
-
104
-
105
-
106
-
107
-
108
-
109
-
110
-
111
-
112
-
113
-
114
-
115
-
116
-
117
-
118
-
119
-
120
-
121
-
122
-
123
-
124
-
125
-
126
-
127
-
128
-
129
-
130
-
131
-
132
-
133
-
134
-
135
-
136
-
137
-
138
-
139
-
140
-
141
-
142
-
143
-
144
-
145
-
146
-
147
-
148
-
149
-
150
-
151
-
152
-
153
-
154
-
155
-
156
-
157
-
158
-
159
-
160
-
161
-
162
-
163
-
164
-
165
-
166
-
167
-
168
-
169
-
170
-
171
-
172
-
173
-
174
-
175
-
176
-
177
-
178
-
179
-
180
-
181
-
182
-
183
-
184
-
185
-
186
-
187
-
188
-
189
-
190
-
191
-
192
-
193
-
194
-
195
-
196
-
197
-
198
-
199
-
200
-
201
-
202
-
203
-
204
-
205
-
206
-
207
-
208
-
209
-
210
-
211
-
212
-
213
-
214
-
215
-
216
-
217
-
218
-
219
-
220
-
221
-
222
-
223
-
224
-
225
-
226
-
227
-
228
-
229
-
230
-
231
-
232
-
233
-
234
-
235
-
236
-
237
-
238
-
239
-
240
-
241
-
242
-
243
-
244
-
245
-
246
-
247
-
248
-
249
-
250
-
251
-
252
-
253
-
254
-
255
-
256
-
257
-
258
-
259
-
260
-
261
-
262
-
263
-
264
-
265
-
266
 |
 |

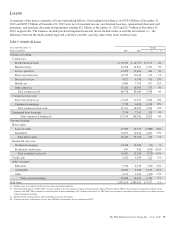
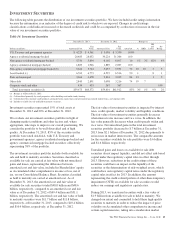
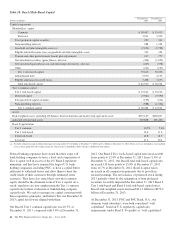
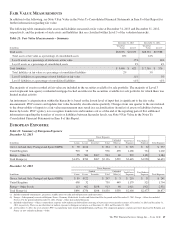
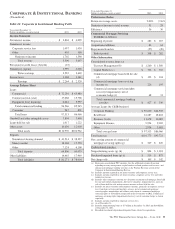
Table 18: Basel I Risk-Based Capital
Dollars in millions
December 31
2013
December 31
2012
Capital components
Shareholders’ equity
Common $ 38,467 $ 35,413
Preferred 3,941 3,590
Trust preferred capital securities 199 331
Noncontrolling interests 988 1,354
Goodwill and other intangible assets (a) (9,654) (9,798)
Eligible deferred income taxes on goodwill and other intangible assets 333 354
Pension and other postretirement benefit plan adjustments 237 777
Net unrealized securities (gains)/losses, after-tax (434) (1,052)
Net unrealized (gains)/losses on cash flow hedge derivatives, after-tax (243) (578)
Other (222) (165)
Tier 1 risk-based capital 33,612 30,226
Subordinated debt 5,930 4,735
Eligible allowance for credit losses 3,408 3,273
Total risk-based capital $ 42,950 $ 38,234
Tier 1 common capital
Tier 1 risk-based capital $ 33,612 $ 30,226
Preferred equity (3,941) (3,590)
Trust preferred capital securities (199) (331)
Noncontrolling interests (988) (1,354)
Tier 1 common capital $ 28,484 $ 24,951
Assets
Risk-weighted assets, including off-balance sheet instruments and market risk equivalent assets $272,169 $260,847
Adjusted average total assets 303,828 291,426
Basel I capital ratios
Tier 1 common 10.5% 9.6%
Tier 1 risk-based 12.4 11.6
Total risk-based 15.8 14.7
Leverage 11.1 10.4
(a) Excludes commercial and residential mortgage servicing rights of $1.6 billion at December 31, 2013 and $1.1 billion at December 31, 2012. These assets are included in risk-weighted
assets at their applicable risk weights except for a haircut that is included in Other which is a deduction from capital.
Federal banking regulators have stated that they expect all
bank holding companies to have a level and composition of
Tier 1 capital well in excess of the 4% Basel I regulatory
minimum, and they have required the largest U.S. bank
holding companies, including PNC, to have a capital buffer
sufficient to withstand losses and allow them to meet the
credit needs of their customers through estimated stress
scenarios. They have also stated their view that common
equity should be the dominant form of Tier 1 capital. As a
result, regulators are now emphasizing the Tier 1 common
capital ratio in their evaluation of bank holding company
capital levels. We seek to manage our capital consistent with
these regulatory principles, and believe that our December 31,
2013 capital levels were aligned with them.
Our Basel I Tier 1 common capital ratio was 10.5% at
December 31, 2013, compared with 9.6% at December 31,
2012. Our Basel I Tier 1 risk-based capital ratio increased 80
basis points to 12.4% at December 31, 2013 from 11.6% at
December 31, 2012. Our Basel I total risk-based capital ratio
increased 110 basis points to 15.8% at December 31, 2013
from 14.7% at December 31, 2012. Basel I capital ratios
increased in all comparisons primarily due to growth in
retained earnings. The net issuance of preferred stock during
2013 partially offset by the redemption of trust preferred
securities favorably impacted the December 31, 2013 Basel I
Tier 1 risk-based and Basel I total risk-based capital ratios.
Basel I risk-weighted assets increased $11.3 billion to $272.2
billion at December 31, 2013.
At December 31, 2013, PNC and PNC Bank, N.A., our
domestic bank subsidiary, were both considered “well
capitalized” based on U.S. regulatory capital ratio
requirements under Basel I. To qualify as “well capitalized”
46 The PNC Financial Services Group, Inc. – Form 10-K