PNC Bank 2013 Annual Report Download - page 72
Download and view the complete annual report
Please find page 72 of the 2013 PNC Bank annual report below. You can navigate through the pages in the report by either clicking on the pages listed below, or by using the keyword search tool below to find specific information within the annual report.-
 1
1 -
2
-
3
-
4
-
5
-
6
-
7
-
8
-
9
-
10
-
11
-
12
-
13
-
14
-
15
-
16
-
17
-
18
-
19
-
20
-
21
-
22
-
23
-
24
-
25
-
26
-
27
-
28
-
29
-
30
-
31
-
32
-
33
-
34
-
35
-
36
-
37
-
38
-
39
-
40
-
41
-
42
-
43
-
44
-
45
-
46
-
47
-
48
-
49
-
50
-
51
-
52
-
53
-
54
-
55
-
56
-
57
-
58
-
59
-
60
-
61
-
 62
62 -
 63
63 -
 64
64 -
 65
65 -
 66
66 -
 67
67 -
 68
68 -
 69
69 -
 70
70 -
 71
71 -
 72
72 -
 73
73 -
 74
74 -
 75
75 -
 76
76 -
 77
77 -
 78
78 -
 79
79 -
 80
80 -
 81
81 -
 82
82 -
83
-
84
-
85
-
86
-
87
-
88
-
89
-
90
-
91
-
92
-
93
-
94
-
95
-
96
-
97
-
98
-
99
-
100
-
101
-
102
-
103
-
104
-
105
-
106
-
107
-
108
-
109
-
110
-
111
-
112
-
113
-
114
-
115
-
116
-
117
-
118
-
119
-
120
-
121
-
122
-
123
-
124
-
125
-
126
-
127
-
128
-
129
-
130
-
131
-
132
-
133
-
134
-
135
-
136
-
137
-
138
-
139
-
140
-
141
-
142
-
143
-
144
-
145
-
146
-
147
-
148
-
149
-
150
-
151
-
152
-
153
-
154
-
155
-
156
-
157
-
158
-
159
-
160
-
161
-
162
-
163
-
164
-
165
-
166
-
167
-
168
-
169
-
170
-
171
-
172
-
173
-
174
-
175
-
176
-
177
-
178
-
179
-
180
-
181
-
182
-
183
-
184
-
185
-
186
-
187
-
188
-
189
-
190
-
191
-
192
-
193
-
194
-
195
-
196
-
197
-
198
-
199
-
200
-
201
-
202
-
203
-
204
-
205
-
206
-
207
-
208
-
209
-
210
-
211
-
212
-
213
-
214
-
215
-
216
-
217
-
218
-
219
-
220
-
221
-
222
-
223
-
224
-
225
-
226
-
227
-
228
-
229
-
230
-
231
-
232
-
233
-
234
-
235
-
236
-
237
-
238
-
239
-
240
-
241
-
242
-
243
-
244
-
245
-
246
-
247
-
248
-
249
-
250
-
251
-
252
-
253
-
254
-
255
-
256
-
257
-
258
-
259
-
260
-
261
-
262
-
263
-
264
-
265
-
266
 |
 |
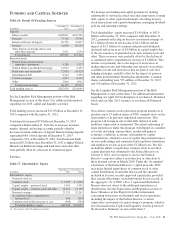
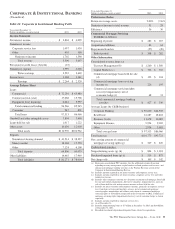
Corporate & Institutional Banking earned $2.3 billion in 2013,
a decrease of $64 million compared with 2012. The decrease
in earnings was due to lower net interest income, partially
offset by an increase in noninterest income, a decrease in
noninterest expenses and a lower provision for credit losses.
We continued to focus on building client relationships,
including increasing cross sales and adding new clients where
the risk-return profile was attractive.
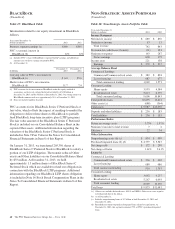
Results for 2013 and 2012 include the impact of the RBC
Bank (USA) acquisition, which added approximately $7.5
billion of loans and $4.8 billion of deposits as of March 2,
2012.
Highlights of Corporate & Institutional Banking’s
performance include the following:
• Corporate & Institutional Banking continued to
execute on strategic initiatives, including in the
Southeast, by organically growing and deepening
client relationships that meet our risk/return
measures. Approximately 740 new primary
Corporate Banking clients were added in 2013.
• Loan commitments increased 9% to $196 billion at
December 31, 2013 compared to December 31, 2012,
primarily due to growth in our Real Estate, Corporate
Banking and Business Credit businesses.
• Period-end loan balances have increased for the
thirteenth consecutive quarter, including an increase
of 2.5% at December 31, 2013 compared with
September 30, 2013 and 8.6% compared with
December 31, 2012.
• Our Treasury Management business, which ranks
among the top providers in the country, continued to
invest in markets, products and infrastructure as well
as major initiatives such as healthcare.
• Midland Loan Services was the number one servicer
of Fannie Mae and Freddie Mac multifamily and
healthcare loans and was the second leading servicer
of commercial and multifamily loans by volume as of
June 30, 2013 according to Mortgage Bankers
Association. Midland has received the highest
primary, master and special servicer ratings for U.S.
commercial mortgage servicing from Fitch Ratings,
Standard & Poor’s and Morningstar.
• Mergers and Acquisitions Journal named Harris
Williams & Co. its 2012 Mid-Market Investment
Bank of the Year. This is the second time in three
years that Harris Williams & Co. has earned the title.
Net interest income was $3.8 billion in 2013, a decrease of
$295 million from 2012, reflecting lower spreads on loans and
deposits and lower purchase accounting accretion, partially
offset by higher average loans and deposits.
Corporate service fees were $1.1 billion in 2013, increasing
$67 million compared to 2012. This increase was primarily
due to higher net commercial mortgage servicing rights
valuations driven by the impact of higher market rates, higher
commercial mortgage servicing fees, net of amortization, and
higher treasury management fees, partially offset by lower
merger and acquisition advisory fees. The majority of
corporate service fees are the noninterest income portion of
treasury management revenue, corporate finance fees,
including revenue from certain capital markets-related
products and services, and the noninterest income portion of
commercial mortgage servicing revenue.
Other noninterest income was $605 million in 2013 compared
with $568 million in 2012. The increase of $37 million was
driven by the impact of higher market interest rates on credit
valuations for customer-related derivative activities and an
increase in revenues from commercial mortgage loans held for
sale, which more than offset lower customer-driven
derivatives revenue.
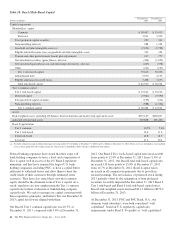
For 2013, there was a benefit from the provision for credit losses
of $25 million compared to zero in 2012, reflecting continued
improvement in credit quality. Net charge-offs were $105 million
in 2013, which represents a decrease of $37 million, or 26%,
compared with 2012 primarily attributable to lower levels of
commercial real estate and commercial charge-offs.
Nonperforming assets declined to $804 million, representing a
32% decrease from December 31, 2012, as a result of
improving credit quality.
Noninterest expense was $2.0 billion in 2013, a decrease of
$29 million from 2012, primarily driven by lower revenue-
related compensation costs, mostly offset by the impact of the
RBC Bank (USA) acquisition and higher asset impairments.
The effective tax rate was 35.9% for 2013 compared with
36.5% for 2012. The decrease in the effective tax rate resulted
from a one-time tax benefit attributable to an assertion under
ASC 740 – Income Taxes that the earnings of certain non-U.S.
subsidiaries will be indefinitely reinvested.
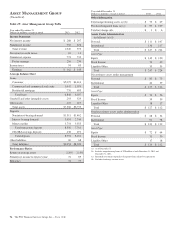
Average loans were $97.5 billion in 2013 compared with
$86.1 billion in 2012, an increase of 13% reflecting strong
growth across each of the commercial lending products.
• The Corporate Banking business provides lending,
treasury management and capital markets-related
products and services to mid-sized corporations,
government and not-for-profit entities, and to large
corporations. Average loans for this business
increased $5.7 billion, or 13%, in 2013 compared
with 2012, primarily due to an increase in loan
commitments from specialty lending businesses.
• PNC Real Estate provides commercial real estate and
real estate-related lending and is one of the industry’s
top providers of both conventional and affordable
multifamily financing. Average loans for this
business increased $3.9 billion, or 21%, in 2013
compared with 2012 due to increased originations.
54 The PNC Financial Services Group, Inc. – Form 10-K