PNC Bank 2013 Annual Report Download - page 74
Download and view the complete annual report
Please find page 74 of the 2013 PNC Bank annual report below. You can navigate through the pages in the report by either clicking on the pages listed below, or by using the keyword search tool below to find specific information within the annual report.-
 1
1 -
2
-
3
-
4
-
5
-
6
-
7
-
8
-
9
-
10
-
11
-
12
-
13
-
14
-
15
-
16
-
17
-
18
-
19
-
20
-
21
-
22
-
23
-
24
-
25
-
26
-
27
-
28
-
29
-
30
-
31
-
32
-
33
-
34
-
35
-
36
-
37
-
38
-
39
-
40
-
41
-
42
-
43
-
44
-
45
-
46
-
47
-
48
-
49
-
50
-
51
-
52
-
53
-
54
-
55
-
56
-
57
-
58
-
59
-
60
-
61
-
62
-
63
-
 64
64 -
 65
65 -
 66
66 -
 67
67 -
 68
68 -
 69
69 -
 70
70 -
 71
71 -
 72
72 -
 73
73 -
 74
74 -
 75
75 -
 76
76 -
 77
77 -
 78
78 -
 79
79 -
 80
80 -
 81
81 -
 82
82 -
 83
83 -
 84
84 -
85
-
86
-
87
-
88
-
89
-
90
-
91
-
92
-
93
-
94
-
95
-
96
-
97
-
98
-
99
-
100
-
101
-
102
-
103
-
104
-
105
-
106
-
107
-
108
-
109
-
110
-
111
-
112
-
113
-
114
-
115
-
116
-
117
-
118
-
119
-
120
-
121
-
122
-
123
-
124
-
125
-
126
-
127
-
128
-
129
-
130
-
131
-
132
-
133
-
134
-
135
-
136
-
137
-
138
-
139
-
140
-
141
-
142
-
143
-
144
-
145
-
146
-
147
-
148
-
149
-
150
-
151
-
152
-
153
-
154
-
155
-
156
-
157
-
158
-
159
-
160
-
161
-
162
-
163
-
164
-
165
-
166
-
167
-
168
-
169
-
170
-
171
-
172
-
173
-
174
-
175
-
176
-
177
-
178
-
179
-
180
-
181
-
182
-
183
-
184
-
185
-
186
-
187
-
188
-
189
-
190
-
191
-
192
-
193
-
194
-
195
-
196
-
197
-
198
-
199
-
200
-
201
-
202
-
203
-
204
-
205
-
206
-
207
-
208
-
209
-
210
-
211
-
212
-
213
-
214
-
215
-
216
-
217
-
218
-
219
-
220
-
221
-
222
-
223
-
224
-
225
-
226
-
227
-
228
-
229
-
230
-
231
-
232
-
233
-
234
-
235
-
236
-
237
-
238
-
239
-
240
-
241
-
242
-
243
-
244
-
245
-
246
-
247
-
248
-
249
-
250
-
251
-
252
-
253
-
254
-
255
-
256
-
257
-
258
-
259
-
260
-
261
-
262
-
263
-
264
-
265
-
266
 |
 |

A
SSET
M
ANAGEMENT
G
ROUP
(Unaudited)
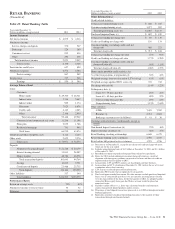
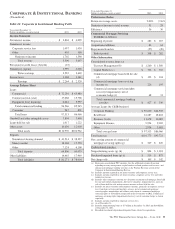
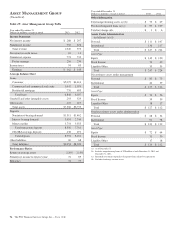
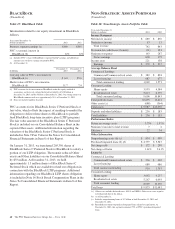
Table 25: Asset Management Group Table
Year ended December 31
Dollars in millions, except as noted 2013 2012
Income Statement
Net interest income $ 288 $ 297
Noninterest income 752 676
Total revenue 1,040 973
Provision for credit losses 10 11
Noninterest expense 774 732
Pretax earnings 256 230
Income taxes 94 85
Earnings $ 162 $ 145
Average Balance Sheet
Loans
Consumer $5,025 $4,416
Commercial and commercial real estate 1,047 1,076
Residential mortgage 776 695
Total loans 6,848 6,187
Goodwill and other intangible assets 293 329
Other assets 225 219
Total assets $7,366 $6,735
Deposits
Noninterest-bearing demand $1,311 $1,462
Interest-bearing demand 3,491 2,746
Money market 3,754 3,553
Total transaction deposits 8,556 7,761
CDs/IRAs/savings deposits 438 491
Total deposits 8,994 8,252
Other liabilities 60 68
Total liabilities $9,054 $8,320
Performance Ratios
Return on average assets 2.20% 2.15%
Noninterest income to total revenue 72 69
Efficiency 74 75
Year ended December 31
Dollars in millions, except as noted 2013 2012
Other Information
Total nonperforming assets (a) (b) $ 75 $ 69
Purchased impaired loans (a) (c) $ 99 $ 109
Total net charge-offs $ 1 $ 6
Assets Under Administration
(in billions) (a) (d)
Personal $ 111 $ 107
Institutional 136 117
Total $ 247 $ 224
Asset Type
Equity $ 142 $ 120
Fixed Income 70 69
Liquidity/Other 35 35
Total $ 247 $ 224
Discretionary assets under management
Personal $ 83 $ 73
Institutional 44 39
Total $ 127 $ 112
Asset Type
Equity $ 70 $ 56
Fixed Income 39 39
Liquidity/Other 18 17
Total $ 127 $ 112
Nondiscretionary assets under administration
Personal $ 28 $ 34
Institutional 92 78
Total $ 120 $ 112
Asset Type
Equity $ 72 $ 64
Fixed Income 31 30
Liquidity/Other 17 18
Total $ 120 $ 112
(a) As of December 31.
(b) Includes nonperforming loans of $70 million at both December 31, 2013 and
December 31, 2012.
(c) Recorded investment of purchased impaired loans related to acquisitions.
(d) Excludes brokerage account assets.
56 The PNC Financial Services Group, Inc. – Form 10-K