PNC Bank 2013 Annual Report Download - page 116
Download and view the complete annual report
Please find page 116 of the 2013 PNC Bank annual report below. You can navigate through the pages in the report by either clicking on the pages listed below, or by using the keyword search tool below to find specific information within the annual report.-
 1
1 -
2
-
3
-
4
-
5
-
6
-
7
-
8
-
9
-
10
-
11
-
12
-
13
-
14
-
15
-
16
-
17
-
18
-
19
-
20
-
21
-
22
-
23
-
24
-
25
-
26
-
27
-
28
-
29
-
30
-
31
-
32
-
33
-
34
-
35
-
36
-
37
-
38
-
39
-
40
-
41
-
42
-
43
-
44
-
45
-
46
-
47
-
48
-
49
-
50
-
51
-
52
-
53
-
54
-
55
-
56
-
57
-
58
-
59
-
60
-
61
-
62
-
63
-
64
-
65
-
66
-
67
-
68
-
69
-
70
-
71
-
72
-
73
-
74
-
75
-
76
-
77
-
78
-
79
-
80
-
81
-
82
-
83
-
84
-
85
-
86
-
87
-
88
-
89
-
90
-
91
-
92
-
93
-
94
-
95
-
96
-
97
-
98
-
99
-
100
-
101
-
102
-
103
-
104
-
105
-
 106
106 -
 107
107 -
 108
108 -
 109
109 -
 110
110 -
 111
111 -
 112
112 -
 113
113 -
 114
114 -
 115
115 -
 116
116 -
 117
117 -
 118
118 -
 119
119 -
 120
120 -
 121
121 -
 122
122 -
 123
123 -
 124
124 -
 125
125 -
 126
126 -
127
-
128
-
129
-
130
-
131
-
132
-
133
-
134
-
135
-
136
-
137
-
138
-
139
-
140
-
141
-
142
-
143
-
144
-
145
-
146
-
147
-
148
-
149
-
150
-
151
-
152
-
153
-
154
-
155
-
156
-
157
-
158
-
159
-
160
-
161
-
162
-
163
-
164
-
165
-
166
-
167
-
168
-
169
-
170
-
171
-
172
-
173
-
174
-
175
-
176
-
177
-
178
-
179
-
180
-
181
-
182
-
183
-
184
-
185
-
186
-
187
-
188
-
189
-
190
-
191
-
192
-
193
-
194
-
195
-
196
-
197
-
198
-
199
-
200
-
201
-
202
-
203
-
204
-
205
-
206
-
207
-
208
-
209
-
210
-
211
-
212
-
213
-
214
-
215
-
216
-
217
-
218
-
219
-
220
-
221
-
222
-
223
-
224
-
225
-
226
-
227
-
228
-
229
-
230
-
231
-
232
-
233
-
234
-
235
-
236
-
237
-
238
-
239
-
240
-
241
-
242
-
243
-
244
-
245
-
246
-
247
-
248
-
249
-
250
-
251
-
252
-
253
-
254
-
255
-
256
-
257
-
258
-
259
-
260
-
261
-
262
-
263
-
264
-
265
-
266
 |
 |
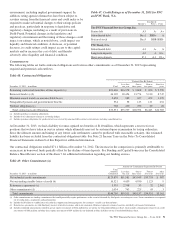
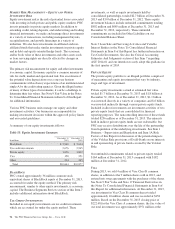
Loans represented 61% of total assets at December 31, 2012
and 59% of total assets at December 31, 2011. Commercial
lending represented 59% of the loan portfolio at December 31,
2012 and 56% at December 31, 2011. Consumer lending
represented 41% of the loan portfolio at December 31, 2012
and 44% at December 31, 2011. Commercial real estate loans
represented 6% of total assets at both December 31, 2012 and
December 31, 2011.
Investment Securities
The carrying amount of investment securities totaled $61.4
billion at December 31, 2012 compared to $60.6 billion at
December 31, 2011. The increase primarily reflected an
increase of $2.0 billion in available for sale asset-backed
securities, which was primarily due to net purchase activity,
and an increase of $.6 billion in available for sale non-agency
residential mortgage-backed securities due to increases in fair
value at December 31, 2012. These increases were partially
offset by a $1.7 billion decrease in held to maturity debt
securities due to principal payments. Investment securities
represented 20% of total assets at December 31, 2012 and
22% at December 31, 2011. Average investment securities
increased $1.1 billion to $60.8 billion in 2012 compared with
2011. Total investment securities comprised 24% of average
interest-earning assets for 2012 and 27% for 2011.
At December 31, 2012, the securities available for sale
portfolio included a net unrealized gain of $1.6 billion, which
represented the difference between fair value and amortized
cost. The comparable amount at December 31, 2011 was a net
unrealized loss of $41 million. As of December 31, 2012, the
amortized cost and fair value of held to maturity securities
were $10.4 billion and $10.9 billion, respectively, compared
to $12.1 billion and $12.5 billion, respectively, at
December 31, 2011. The weighted-average expected maturity
of the investment securities portfolio (excluding corporate
stocks and other) was 4.0 years at December 31, 2012 and 3.7
years at December 31, 2011.
Loans Held For Sale
Loans held for sale totaled $3.7 billion at December 31, 2012
compared with $2.9 billion at December 31, 2011.
For commercial mortgages held for sale designated at fair
value, we stopped originating these and have pursued
opportunities to reduce these positions. At December 31,
2012, the balance relating to these loans was $772 million,
compared to $843 million at December 31, 2011. For
commercial mortgages held for sale at lower of cost or fair
value, we sold $2.2 billion during 2012 compared with $2.4
billion in 2011. The increase in these loans to $620 million at
December 31, 2012, compared to $451 million at
December 31, 2011, was due to an increase in loans awaiting
sale to government agencies. We recognized total net gains of
$41 million in 2012 and $48 million in 2011 on the valuation
and sale of commercial mortgage loans held for sale, net of
hedges.
Residential mortgage loan origination volume was $15.2
billion in 2012 compared with $11.4 billion in 2011.
Substantially all such loans were originated under agency or
FHA standards. We sold $13.8 billion of loans and recognized
related gains of $747 million during 2012. The comparable
amounts for 2011 were $11.9 billion and $384 million,
respectively.
Asset Quality
Overall credit quality continued to improve during 2012.
Nonperforming loans declined $.3 billion, or 9%, to $3.3
billion as of December 31, 2012 from December 31, 2011.
Overall loan delinquencies decreased $.8 billion, or 18%, to
$3.7 billion at December 31, 2012 compared to the prior year
end. Net charge-offs decreased to $1.3 billion in 2012, a
decrease of $.3 billion, or 21%, compared to 2011.
The ALLL was $4.0 billion, or 2.17% of total loans and 124%
of nonperforming loans, as of December 31, 2012, compared
to $4.3 billion, or 2.73% of total loans and 122% of
nonperforming loans, as of December 31, 2011.
At December 31, 2012, our largest nonperforming asset was
$38 million in the Real Estate Rental and Leasing Industry
and our average nonperforming loan associated with
commercial lending was under $1 million.
Goodwill and Other Intangible Assets
Goodwill and other intangible assets totaled $10.9 billion at
December 31, 2012 and $10.1 billion at December 31, 2011.
During 2012, we recorded goodwill of $950 million and other
intangible assets of $180 million associated with the RBC
Bank (USA) acquisition. In the fourth quarter of 2012, we sold
certain deposits and assets of the Smartstreet business unit,
which was acquired by PNC as part of the RBC Bank (USA)
acquisition, which resulted in a reduction of goodwill and core
deposit intangibles by approximately $46 million and $13
million, respectively. Also in the fourth quarter of 2012, we
recorded a $45 million noncash charge for goodwill
impairment related to PNC’s Residential Mortgage Banking
reporting unit. See Note 2 Acquisition and Divestiture
Activity and Note 10 Goodwill and Other Intangible Assets in
the Notes To Consolidated Financial Statements included in
Item 8 of this Report and in our 2012 Form 10-K.
Funding Sources
Total funding sources were $254.0 billion at December 31,
2012 and $224.7 billion at December 31, 2011.
Total deposits increased $25.2 billion, or 13%, at December 31,
2012 to $213.1 billion compared to December 31, 2011. On
March 2, 2012, our RBC Bank (USA) acquisition added $18.1
billion of deposits, including $6.9 billion of money market, $6.7
billion of demand, $4.1 billion of retail certificates of deposit, and
$.4 billion of savings. Excluding acquisition activity, money
market and demand deposits increased during 2012, partially
offset by the runoff of maturing retail certificates of deposit.
98 The PNC Financial Services Group, Inc. – Form 10-K