PNC Bank 2013 Annual Report Download - page 62
Download and view the complete annual report
Please find page 62 of the 2013 PNC Bank annual report below. You can navigate through the pages in the report by either clicking on the pages listed below, or by using the keyword search tool below to find specific information within the annual report.-
 1
1 -
2
-
3
-
4
-
5
-
6
-
7
-
8
-
9
-
10
-
11
-
12
-
13
-
14
-
15
-
16
-
17
-
18
-
19
-
20
-
21
-
22
-
23
-
24
-
25
-
26
-
27
-
28
-
29
-
30
-
31
-
32
-
33
-
34
-
35
-
36
-
37
-
38
-
39
-
40
-
41
-
42
-
43
-
44
-
45
-
46
-
47
-
48
-
49
-
50
-
51
-
 52
52 -
 53
53 -
 54
54 -
 55
55 -
 56
56 -
 57
57 -
 58
58 -
 59
59 -
 60
60 -
 61
61 -
 62
62 -
 63
63 -
 64
64 -
 65
65 -
 66
66 -
 67
67 -
 68
68 -
 69
69 -
 70
70 -
 71
71 -
 72
72 -
73
-
74
-
75
-
76
-
77
-
78
-
79
-
80
-
81
-
82
-
83
-
84
-
85
-
86
-
87
-
88
-
89
-
90
-
91
-
92
-
93
-
94
-
95
-
96
-
97
-
98
-
99
-
100
-
101
-
102
-
103
-
104
-
105
-
106
-
107
-
108
-
109
-
110
-
111
-
112
-
113
-
114
-
115
-
116
-
117
-
118
-
119
-
120
-
121
-
122
-
123
-
124
-
125
-
126
-
127
-
128
-
129
-
130
-
131
-
132
-
133
-
134
-
135
-
136
-
137
-
138
-
139
-
140
-
141
-
142
-
143
-
144
-
145
-
146
-
147
-
148
-
149
-
150
-
151
-
152
-
153
-
154
-
155
-
156
-
157
-
158
-
159
-
160
-
161
-
162
-
163
-
164
-
165
-
166
-
167
-
168
-
169
-
170
-
171
-
172
-
173
-
174
-
175
-
176
-
177
-
178
-
179
-
180
-
181
-
182
-
183
-
184
-
185
-
186
-
187
-
188
-
189
-
190
-
191
-
192
-
193
-
194
-
195
-
196
-
197
-
198
-
199
-
200
-
201
-
202
-
203
-
204
-
205
-
206
-
207
-
208
-
209
-
210
-
211
-
212
-
213
-
214
-
215
-
216
-
217
-
218
-
219
-
220
-
221
-
222
-
223
-
224
-
225
-
226
-
227
-
228
-
229
-
230
-
231
-
232
-
233
-
234
-
235
-
236
-
237
-
238
-
239
-
240
-
241
-
242
-
243
-
244
-
245
-
246
-
247
-
248
-
249
-
250
-
251
-
252
-
253
-
254
-
255
-
256
-
257
-
258
-
259
-
260
-
261
-
262
-
263
-
264
-
265
-
266
 |
 |

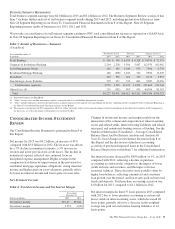
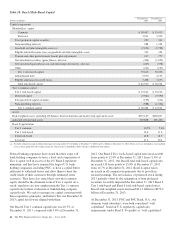
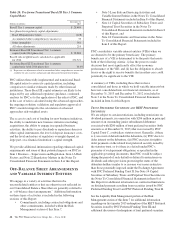
conditions and changes to regulatory capital requirements
under Basel III capital standards. Beginning in 2014, other
comprehensive income related to available for sale securities
(as well as pension and other post-retirement plans) are
included in PNC’s regulatory capital (subject to a phase-in
schedule) and, therefore will affect PNC’s regulatory capital
ratios. For additional information, see the Supervision and
Regulation section in Item 1 – Business and the Capital
portion of the Balance Sheet Review section in this Item 7 of
this Report.
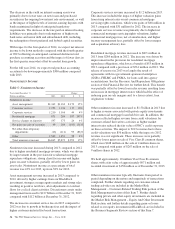
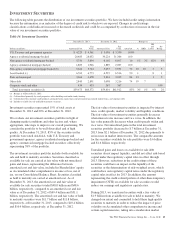
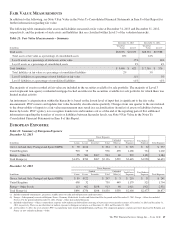
The duration of investment securities was 2.9 years at
December 31, 2013. We estimate that, at December 31, 2013,
the effective duration of investment securities was 3.0 years
for an immediate 50 basis points parallel increase in interest
rates and 2.8 years for an immediate 50 basis points parallel
decrease in interest rates. Comparable amounts at
December 31, 2012 were 2.3 years and 2.2 years, respectively.
We conduct a quarterly comprehensive security-level
impairment assessment on all securities. For securities in an
unrealized loss position, we determine whether the loss
represents OTTI. For debt securities that we neither intend to
sell nor believe we will be required to sell prior to expected
recovery, we recognize the credit portion of OTTI charges in
current earnings and include the noncredit portion of OTTI in
Net unrealized gains (losses) on OTTI securities on our
Consolidated Statement of Comprehensive Income and net of
tax in Accumulated other comprehensive income (loss) on our
Consolidated Balance Sheet. During 2013 and 2012 we
recognized OTTI credit losses of $16 million and $111
million, respectively. Substantially all of the credit losses
related to residential mortgage-backed and asset-backed
securities collateralized by non-agency residential loans.
If current housing and economic conditions were to
deteriorate from current levels, and if market volatility and
illiquidity were to deteriorate from current levels, or if market
interest rates were to increase or credit spreads were to widen
appreciably, the valuation of our investment securities
portfolio could be adversely affected and we could incur
additional OTTI credit losses that would impact our
Consolidated Income Statement.
Additional information regarding our investment securities is
included in Note 8 Investment Securities and Note 9 Fair
Value in the Notes To Consolidated Financial Statements
included in Item 8 of this Report.
L
OANS
H
ELD FOR
S
ALE
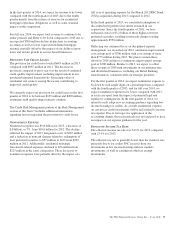
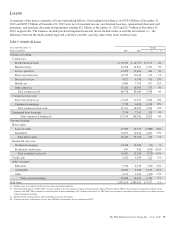
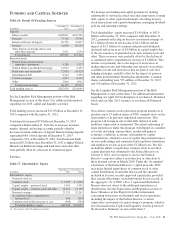
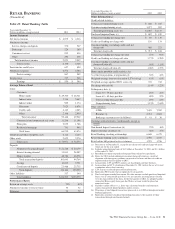
Table 15: Loans Held For Sale
In millions
December 31
2013
December 31
2012
Commercial mortgages at fair value $ 586 $ 772
Commercial mortgages at lower of cost or
fair value 281 620
Total commercial mortgages 867 1,392
Residential mortgages at fair value 1,315 2,096
Residential mortgages at lower of cost or
fair value 41 124
Total residential mortgages 1,356 2,220
Other 32 81
Total $2,255 $3,693
For commercial mortgages held for sale designated at fair
value, we stopped originating these and continue to pursue
opportunities to reduce these positions. At December 31,
2013, the balance relating to these loans was $586 million
compared to $772 million at December 31, 2012. For
commercial mortgages held for sale carried at lower of cost or
fair value, we sold $2.8 billion in 2013 compared to $2.2
billion in 2012. All of these loan sales were to government
agencies. Total gains of $79 million were recognized on the
valuation and sale of commercial mortgage loans held for sale,
net of hedges, in 2013, and $41 million in 2012.
Residential mortgage loan origination volume was $15.1
billion in 2013 compared to $15.2 billion in 2012.
Substantially all such loans were originated under agency or
Federal Housing Administration (FHA) standards. We sold
$14.7 billion of loans and recognized related gains of $568
million in 2013. The comparable amounts for 2012 were $13.8
billion and $747 million, respectively.
Interest income on loans held for sale was $157 million in
2013 and $168 million in 2012. These amounts are included in
Other interest income on our Consolidated Income Statement.
Additional information regarding our loan sale and servicing
activities is included in Note 3 Loan Sales and Servicing
Activities and Variable Interest Entities and Note 9 Fair Value
in our Notes To Consolidated Financial Statements included
in Item 8 of this Report.
G
OODWILL AND
O
THER
I
NTANGIBLE
A
SSETS
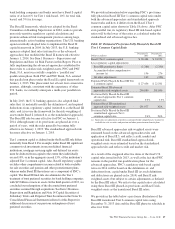
Goodwill and other intangible assets totaled $11.3 billion at
December 31, 2013 and $10.9 billion at December 31, 2012.
The increase of $.4 billion was primarily due to additions to
and changes in value of mortgage and other loan servicing
rights. See additional information regarding our goodwill and
intangible assets in Note 10 Goodwill and Other Intangible
Assets included in the Notes To Consolidated Financial
Statements in Item 8 of this Report.
44 The PNC Financial Services Group, Inc. – Form 10-K