PNC Bank 2013 Annual Report Download - page 112
Download and view the complete annual report
Please find page 112 of the 2013 PNC Bank annual report below. You can navigate through the pages in the report by either clicking on the pages listed below, or by using the keyword search tool below to find specific information within the annual report.-
 1
1 -
2
-
3
-
4
-
5
-
6
-
7
-
8
-
9
-
10
-
11
-
12
-
13
-
14
-
15
-
16
-
17
-
18
-
19
-
20
-
21
-
22
-
23
-
24
-
25
-
26
-
27
-
28
-
29
-
30
-
31
-
32
-
33
-
34
-
35
-
36
-
37
-
38
-
39
-
40
-
41
-
42
-
43
-
44
-
45
-
46
-
47
-
48
-
49
-
50
-
51
-
52
-
53
-
54
-
55
-
56
-
57
-
58
-
59
-
60
-
61
-
62
-
63
-
64
-
65
-
66
-
67
-
68
-
69
-
70
-
71
-
72
-
73
-
74
-
75
-
76
-
77
-
78
-
79
-
80
-
81
-
82
-
83
-
84
-
85
-
86
-
87
-
88
-
89
-
90
-
91
-
92
-
93
-
94
-
95
-
96
-
97
-
98
-
99
-
100
-
101
-
 102
102 -
 103
103 -
 104
104 -
 105
105 -
 106
106 -
 107
107 -
 108
108 -
 109
109 -
 110
110 -
 111
111 -
 112
112 -
 113
113 -
 114
114 -
 115
115 -
 116
116 -
 117
117 -
 118
118 -
 119
119 -
 120
120 -
 121
121 -
 122
122 -
123
-
124
-
125
-
126
-
127
-
128
-
129
-
130
-
131
-
132
-
133
-
134
-
135
-
136
-
137
-
138
-
139
-
140
-
141
-
142
-
143
-
144
-
145
-
146
-
147
-
148
-
149
-
150
-
151
-
152
-
153
-
154
-
155
-
156
-
157
-
158
-
159
-
160
-
161
-
162
-
163
-
164
-
165
-
166
-
167
-
168
-
169
-
170
-
171
-
172
-
173
-
174
-
175
-
176
-
177
-
178
-
179
-
180
-
181
-
182
-
183
-
184
-
185
-
186
-
187
-
188
-
189
-
190
-
191
-
192
-
193
-
194
-
195
-
196
-
197
-
198
-
199
-
200
-
201
-
202
-
203
-
204
-
205
-
206
-
207
-
208
-
209
-
210
-
211
-
212
-
213
-
214
-
215
-
216
-
217
-
218
-
219
-
220
-
221
-
222
-
223
-
224
-
225
-
226
-
227
-
228
-
229
-
230
-
231
-
232
-
233
-
234
-
235
-
236
-
237
-
238
-
239
-
240
-
241
-
242
-
243
-
244
-
245
-
246
-
247
-
248
-
249
-
250
-
251
-
252
-
253
-
254
-
255
-
256
-
257
-
258
-
259
-
260
-
261
-
262
-
263
-
264
-
265
-
266
 |
 |

M
ARKET
R
ISK
M
ANAGEMENT
–E
QUITY AND
O
THER
I
NVESTMENT
R
ISK
Equity investment risk is the risk of potential losses associated
with investing in both private and public equity markets. PNC
invests primarily in private equity markets. In addition to
extending credit, taking deposits, and underwriting and trading
financial instruments, we make and manage direct investments
in a variety of transactions, including management buyouts,
recapitalizations, and growth financings in a variety of
industries. We also have investments in affiliated and non-
affiliated funds that make similar investments in private equity
and in debt and equity-oriented hedge funds. The economic
and/or book value of these investments and other assets such
as loan servicing rights are directly affected by changes in
market factors.
The primary risk measurement for equity and other investments
is economic capital. Economic capital is a common measure of
risk for credit, market and operational risk. It is an estimate of
the potential value depreciation over a one year horizon
commensurate with solvency expectations of an institution rated
single-A by the credit rating agencies. Given the illiquid nature
of many of these types of investments, it can be a challenge to
determine their fair values. See Note 9 Fair Value in the Notes
To Consolidated Financial Statements in Item 8 of this Report
for additional information.
Various PNC business units manage our equity and other
investment activities. Our businesses are responsible for
making investment decisions within the approved policy limits
and associated guidelines.
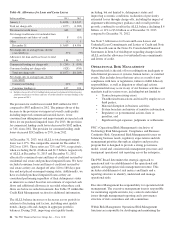
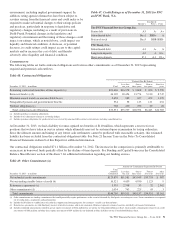
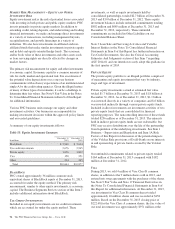
A summary of our equity investments follows:
Table 55: Equity Investments Summary
In millions
December 31
2013
December 31
2012
BlackRock $ 5,940 $ 5,614
Tax credit investments 2,676 2,965
Private equity 1,656 1,802
Visa 158 251
Other 234 245
Total $10,664 $10,877
B
LACK
R
OCK
PNC owned approximately 36 million common stock
equivalent shares of BlackRock equity at December 31, 2013,
accounted for under the equity method. The primary risk
measurement, similar to other equity investments, is economic
capital. The Business Segments Review section of this Item 7
includes additional information about BlackRock.
T
AX
C
REDIT
I
NVESTMENTS
Included in our equity investments are tax credit investments
which are accounted for under the equity method. These
investments, as well as equity investments held by
consolidated partnerships, totaled $2.7 billion at December 31,
2013 and $3.0 billion at December 31, 2012. These equity
investment balances include unfunded commitments totaling
$802 million and $685 million at December 31, 2013 and
December 31, 2012, respectively. These unfunded
commitments are included in Other Liabilities on our
Consolidated Balance Sheet.
Note 3 Loan Sale and Servicing Activities and Variable
Interest Entities in the Notes To Consolidated Financial
Statements in Item 8 of this Report has further information on
Tax Credit Investments. See also the Critical Accounting
Estimates And Judgments section of this Item 7 regarding
ASU 2014-01 and our intention to early adopt this guidance in
the first quarter of 2014.
P
RIVATE
E
QUITY
The private equity portfolio is an illiquid portfolio comprised
of mezzanine and equity investments that vary by industry,
stage and type of investment.
Private equity investments carried at estimated fair value
totaled $1.7 billion at December 31, 2013 and $1.8 billion at
December 31, 2012. As of December 31, 2013, $1.1 billion
was invested directly in a variety of companies and $.6 billion
was invested indirectly through various private equity funds.
Included in direct investments are investment activities of two
private equity funds that are consolidated for financial
reporting purposes. The noncontrolling interests of these funds
totaled $236 million as of December 31, 2013. The interests
held in indirect private equity funds are not redeemable, but
PNC may receive distributions over the life of the partnership
from liquidation of the underlying investments. See Item 1
Business – Supervision and Regulation and Item 1A Risk
Factors of this Report for discussion of the potential impacts
of the Volcker Rule provisions of Dodd-Frank on our interests
in and sponsorship of private funds covered by the Volcker
Rule.
Our unfunded commitments related to private equity totaled
$164 million at December 31, 2013 compared with $182
million at December 31, 2012.
V
ISA
During 2013, we sold 4 million of Visa Class B common
shares, in addition to the 9 million shares sold in 2012, and
entered into swap agreements with the purchaser of the shares.
See Note 9 Fair Value and Note 17 Financial Derivatives in
the Notes To Consolidated Financial Statements in Item 8 of
this Report for additional information. At December 31, 2013,
our investment in Visa Class B common shares totaled
approximately 10 million shares and was recorded at $158
million. Based on the December 31, 2013 closing price of
$222.68 for the Visa Class A common shares, the fair value of
our total investment was approximately $971 million at the
94 The PNC Financial Services Group, Inc. – Form 10-K