PNC Bank 2013 Annual Report Download - page 67
Download and view the complete annual report
Please find page 67 of the 2013 PNC Bank annual report below. You can navigate through the pages in the report by either clicking on the pages listed below, or by using the keyword search tool below to find specific information within the annual report.-
 1
1 -
2
-
3
-
4
-
5
-
6
-
7
-
8
-
9
-
10
-
11
-
12
-
13
-
14
-
15
-
16
-
17
-
18
-
19
-
20
-
21
-
22
-
23
-
24
-
25
-
26
-
27
-
28
-
29
-
30
-
31
-
32
-
33
-
34
-
35
-
36
-
37
-
38
-
39
-
40
-
41
-
42
-
43
-
44
-
45
-
46
-
47
-
48
-
49
-
50
-
51
-
52
-
53
-
54
-
55
-
56
-
 57
57 -
 58
58 -
 59
59 -
 60
60 -
 61
61 -
 62
62 -
 63
63 -
 64
64 -
 65
65 -
 66
66 -
 67
67 -
 68
68 -
 69
69 -
 70
70 -
 71
71 -
 72
72 -
 73
73 -
 74
74 -
 75
75 -
 76
76 -
 77
77 -
78
-
79
-
80
-
81
-
82
-
83
-
84
-
85
-
86
-
87
-
88
-
89
-
90
-
91
-
92
-
93
-
94
-
95
-
96
-
97
-
98
-
99
-
100
-
101
-
102
-
103
-
104
-
105
-
106
-
107
-
108
-
109
-
110
-
111
-
112
-
113
-
114
-
115
-
116
-
117
-
118
-
119
-
120
-
121
-
122
-
123
-
124
-
125
-
126
-
127
-
128
-
129
-
130
-
131
-
132
-
133
-
134
-
135
-
136
-
137
-
138
-
139
-
140
-
141
-
142
-
143
-
144
-
145
-
146
-
147
-
148
-
149
-
150
-
151
-
152
-
153
-
154
-
155
-
156
-
157
-
158
-
159
-
160
-
161
-
162
-
163
-
164
-
165
-
166
-
167
-
168
-
169
-
170
-
171
-
172
-
173
-
174
-
175
-
176
-
177
-
178
-
179
-
180
-
181
-
182
-
183
-
184
-
185
-
186
-
187
-
188
-
189
-
190
-
191
-
192
-
193
-
194
-
195
-
196
-
197
-
198
-
199
-
200
-
201
-
202
-
203
-
204
-
205
-
206
-
207
-
208
-
209
-
210
-
211
-
212
-
213
-
214
-
215
-
216
-
217
-
218
-
219
-
220
-
221
-
222
-
223
-
224
-
225
-
226
-
227
-
228
-
229
-
230
-
231
-
232
-
233
-
234
-
235
-
236
-
237
-
238
-
239
-
240
-
241
-
242
-
243
-
244
-
245
-
246
-
247
-
248
-
249
-
250
-
251
-
252
-
253
-
254
-
255
-
256
-
257
-
258
-
259
-
260
-
261
-
262
-
263
-
264
-
265
-
266
 |
 |
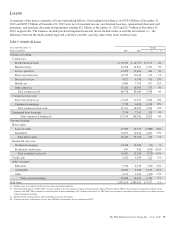
F
AIR
V
ALUE
M
EASUREMENTS
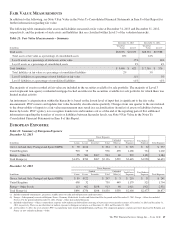
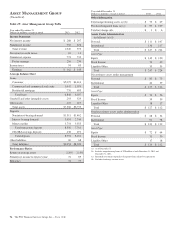
In addition to the following, see Note 9 Fair Value in the Notes To Consolidated Financial Statements in Item 8 of this Report for
further information regarding fair value.
The following table summarizes the assets and liabilities measured at fair value at December 31, 2013 and December 31, 2012,
respectively, and the portions of such assets and liabilities that are classified within Level 3 of the valuation hierarchy.
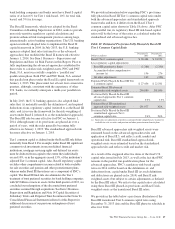
Table 21: Fair Value Measurements – Summary
December 31, 2013 December 31, 2012
In millions
Total Fair
Value Level 3
Total Fair
Value Level 3
Total assets $63,096 $10,635 $68,352 $10,988
Total assets at fair value as a percentage of consolidated assets 20% 22%
Level 3 assets as a percentage of total assets at fair value 17% 16%
Level 3 assets as a percentage of consolidated assets 3% 4%
Total liabilities $ 5,460 $ 623 $ 7,356 $ 376
Total liabilities at fair value as a percentage of consolidated liabilities 2% 3%
Level 3 liabilities as a percentage of total liabilities at fair value 11% 5%
Level 3 liabilities as a percentage of consolidated liabilities <1% <1%
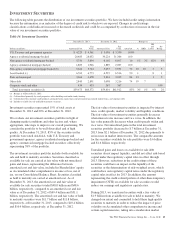
The majority of assets recorded at fair value are included in the securities available for sale portfolio. The majority of Level 3
assets represent non-agency residential mortgage-backed securities in the securities available for sale portfolio for which there was
limited market activity.
An instrument’s categorization within the hierarchy is based on the lowest level of input that is significant to the fair value
measurement. PNC reviews and updates fair value hierarchy classifications quarterly. Changes from one quarter to the next related
to the observability of inputs to a fair value measurement may result in a reclassification (transfer) of assets or liabilities between
hierarchy levels. PNC’s policy is to recognize transfers in and transfers out as of the end of the reporting period. For additional
information regarding the transfers of assets or liabilities between hierarchy levels, see Note 9 Fair Value in the Notes To
Consolidated Financial Statements in Item 8 of this Report.
E
UROPEAN
E
XPOSURE
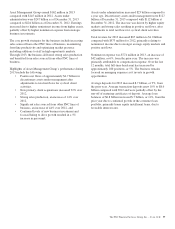
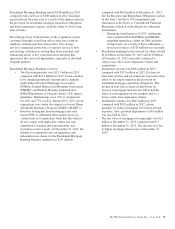
Table 22: Summary of European Exposure
December 31, 2013 Direct Exposure
Funded Unfunded Total Direct
Exposure
Total Indirect
ExposureIn millions Loans Leases Securities Total Other (a) Total Exposure
Greece, Ireland, Italy, Portugal and Spain (GIIPS) $ 78 $126 $ 204 $ 1 $ 205 $ 32 $ 237
United Kingdom 903 75 978 490 1,468 734 2,202
Europe – Other (b) 95 582 $267 944 48 992 1,192 2,184
Total Europe (c) $1,076 $783 $267 $2,126 $539 $2,665 $1,958 $4,623
December 31, 2012 Direct Exposure
Funded Unfunded Total Direct
Exposure
Total Indirect
ExposureIn millions Loans Leases Securities Total Other (a) Total Exposure
Greece, Ireland, Italy, Portugal and Spain (GIIPS) $ 85 $122 $ 207 $ 3 $ 210 $ 31 $ 241
United Kingdom 698 32 730 449 1,179 525 1,704
Europe – Other (b) (d) 113 602 $198 913 98 1,011 1,921 2,932
Total Europe (c) $896 $756 $198 $1,850 $550 $2,400 $2,477 $4,877
(a) Includes unfunded commitments, guarantees, standby letters of credit and sold protection credit derivatives.
(b) Europe – Other primarily consists of Belgium, France, Germany, Netherlands, Sweden and Switzerland. For the period ended December 31, 2013, Europe – Other also included
Norway. For the period ended December 31, 2012, Europe – Other also included Denmark.
(c) Included within Europe – Other is funded direct exposure of $8 million and $168 million consisting of AAA-rated sovereign debt securities at December 31, 2013 and December 31,
2012, respectively. There was no other direct or indirect exposure to European sovereigns as of December 31, 2013 and December 31, 2012.
(d) At December 31, 2012, the seven countries PNC was monitoring more closely included Belgium and France. For comparison purposes, amounts previously disclosed for Belgium and
France are now included in Europe – Other.
The PNC Financial Services Group, Inc. – Form 10-K 49