PNC Bank 2013 Annual Report Download - page 50
Download and view the complete annual report
Please find page 50 of the 2013 PNC Bank annual report below. You can navigate through the pages in the report by either clicking on the pages listed below, or by using the keyword search tool below to find specific information within the annual report.-
 1
1 -
2
-
3
-
4
-
5
-
6
-
7
-
8
-
9
-
10
-
11
-
12
-
13
-
14
-
15
-
16
-
17
-
18
-
19
-
20
-
21
-
22
-
23
-
24
-
25
-
26
-
27
-
28
-
29
-
30
-
31
-
32
-
33
-
34
-
35
-
36
-
37
-
38
-
39
-
 40
40 -
 41
41 -
 42
42 -
 43
43 -
 44
44 -
 45
45 -
 46
46 -
 47
47 -
 48
48 -
 49
49 -
 50
50 -
 51
51 -
 52
52 -
 53
53 -
 54
54 -
 55
55 -
 56
56 -
 57
57 -
 58
58 -
 59
59 -
 60
60 -
61
-
62
-
63
-
64
-
65
-
66
-
67
-
68
-
69
-
70
-
71
-
72
-
73
-
74
-
75
-
76
-
77
-
78
-
79
-
80
-
81
-
82
-
83
-
84
-
85
-
86
-
87
-
88
-
89
-
90
-
91
-
92
-
93
-
94
-
95
-
96
-
97
-
98
-
99
-
100
-
101
-
102
-
103
-
104
-
105
-
106
-
107
-
108
-
109
-
110
-
111
-
112
-
113
-
114
-
115
-
116
-
117
-
118
-
119
-
120
-
121
-
122
-
123
-
124
-
125
-
126
-
127
-
128
-
129
-
130
-
131
-
132
-
133
-
134
-
135
-
136
-
137
-
138
-
139
-
140
-
141
-
142
-
143
-
144
-
145
-
146
-
147
-
148
-
149
-
150
-
151
-
152
-
153
-
154
-
155
-
156
-
157
-
158
-
159
-
160
-
161
-
162
-
163
-
164
-
165
-
166
-
167
-
168
-
169
-
170
-
171
-
172
-
173
-
174
-
175
-
176
-
177
-
178
-
179
-
180
-
181
-
182
-
183
-
184
-
185
-
186
-
187
-
188
-
189
-
190
-
191
-
192
-
193
-
194
-
195
-
196
-
197
-
198
-
199
-
200
-
201
-
202
-
203
-
204
-
205
-
206
-
207
-
208
-
209
-
210
-
211
-
212
-
213
-
214
-
215
-
216
-
217
-
218
-
219
-
220
-
221
-
222
-
223
-
224
-
225
-
226
-
227
-
228
-
229
-
230
-
231
-
232
-
233
-
234
-
235
-
236
-
237
-
238
-
239
-
240
-
241
-
242
-
243
-
244
-
245
-
246
-
247
-
248
-
249
-
250
-
251
-
252
-
253
-
254
-
255
-
256
-
257
-
258
-
259
-
260
-
261
-
262
-
263
-
264
-
265
-
266
 |
 |

• Continuing to maintain and grow our deposit base as
a low-cost funding source,
• Prudent risk and capital management related to our
efforts to manage risk to acceptable levels and to
meet evolving regulatory capital and liquidity
standards,
• Actions we take within the capital and other financial
markets,
• The impact of legal and regulatory-related
contingencies, and
• The appropriateness of reserves needed for critical
accounting estimates and related contingencies.
For additional information, please see the Cautionary
Statement Regarding Forward-Looking Information section in
this Item 7 and Item 1A Risk Factors in this Report.
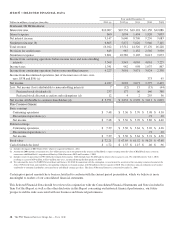
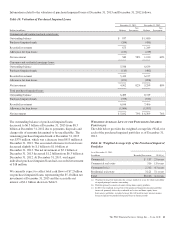
Table 1: Summary Financial Results
Year ended December 31 2013 2012
Net income (millions) $4,227 $3,001
Diluted earnings per common share from net
income $ 7.39 $ 5.30
Return from net income on:
Average common shareholders’ equity 10.88% 8.31%
Average assets 1.38% 1.02%
I
NCOME
S
TATEMENT
H
IGHLIGHTS
Our performance in 2013 included the following:
• Net income for 2013 of $4.2 billion increased 41%
compared to 2012. The increase was driven by a 7%
reduction of noninterest expense, a 3% increase in
revenue and a decline in provision for credit losses.
The increase in revenue was driven by higher
noninterest income, partially offset by lower net
interest income. For additional detail, please see the
Consolidated Income Statement Review section in
this Item 7.
• Net interest income of $9.1 billion for 2013
decreased 5% compared with 2012, as a result of a
decline in purchase accounting accretion, the impact
of lower yields on loans and securities, and the
impact of lower securities balances, partially offset
by higher loan balances, reflecting commercial and
consumer loan growth over the period, and lower
rates paid on borrowed funds and deposits.
• Net interest margin decreased to 3.57% for 2013
compared to 3.94% for 2012, reflecting lower yields
on earning assets and lower purchase accounting
accretion.
• Noninterest income of $6.9 billion for 2013 increased
$1.0 billion compared to 2012, primarily due to higher
residential mortgage revenue, which was driven by
improvement in the provision for residential mortgage
repurchase obligations, strong client fee income and
higher gains on asset valuations, partially offset by
lower gains on asset sales.
• The provision for credit losses decreased to $643
million for 2013 compared to $987 million for 2012
due to continued credit quality improvement, including
improvement in our purchased impaired loan portfolio.
• Noninterest expense of $9.8 billion for 2013
decreased 7% compared with 2012 as we continued
to focus on disciplined expense management. The
decline included lower noncash charges related to
redemption of trust preferred securities and the
impact of 2012 integration costs.
C
REDIT
Q
UALITY
H
IGHLIGHTS
• Overall credit quality continued to improve during
2013.
• Nonperforming assets decreased $.3 billion, or 9%, to
$3.5 billion at December 31, 2013 compared to
December 31, 2012. Nonperforming assets to total
assets were 1.08% at December 31, 2013, compared
to 1.24% at December 31, 2012.
• Overall delinquencies of $2.5 billion decreased $1.3
billion, or 33%, compared with December 31, 2012.
• Net charge-offs of $1.1 billion in 2013 were down
16% compared to net charge-offs of $1.3 billion in
2012. Net charge-offs were 0.57% of average loans
in 2013 and 0.73% of average loans in 2012.
• The allowance for loan and lease losses was 1.84% of
total loans and 117% of nonperforming loans at
December 31, 2013, compared with 2.17% and 124%
at December 31, 2012, respectively.
• The above comparisons to December 31, 2012 were
impacted by alignment with interagency guidance in
the first quarter of 2013 on practices for loans and
lines of credit related to consumer lending. This had
the overall effect of (i) accelerating charge-offs,
(ii) increasing nonperforming loans and (iii) in the
case of loans accounted for under the fair value
option, increasing nonaccrual loans. See the Credit
Risk Management section of this Item 7 and Note 5
Asset Quality in the Notes To Consolidated Financial
Statements in Item 8 of this Report for further detail.
B
ALANCE
S
HEET
H
IGHLIGHTS
• Total loans increased by $9.8 billion to $196 billion at
December 31, 2013 compared to December 31, 2012.
• Total commercial lending increased by $8.2
billion, or 8%, from December 31, 2012, as a
result of growth in commercial loans to new
and existing customers.
• Total consumer lending increased $1.6 billion,
or 2%, from December 31, 2012, primarily
from growth in automobile and home equity
loans, partially offset by paydowns of
education loans.
• Total deposits increased by $7.8 billion to $221 billion
at December 31, 2013 compared with December 31,
2012, driven by growth in transaction deposits.
32 The PNC Financial Services Group, Inc. – Form 10-K