PNC Bank 2013 Annual Report Download - page 102
Download and view the complete annual report
Please find page 102 of the 2013 PNC Bank annual report below. You can navigate through the pages in the report by either clicking on the pages listed below, or by using the keyword search tool below to find specific information within the annual report.-
 1
1 -
2
-
3
-
4
-
5
-
6
-
7
-
8
-
9
-
10
-
11
-
12
-
13
-
14
-
15
-
16
-
17
-
18
-
19
-
20
-
21
-
22
-
23
-
24
-
25
-
26
-
27
-
28
-
29
-
30
-
31
-
32
-
33
-
34
-
35
-
36
-
37
-
38
-
39
-
40
-
41
-
42
-
43
-
44
-
45
-
46
-
47
-
48
-
49
-
50
-
51
-
52
-
53
-
54
-
55
-
56
-
57
-
58
-
59
-
60
-
61
-
62
-
63
-
64
-
65
-
66
-
67
-
68
-
69
-
70
-
71
-
72
-
73
-
74
-
75
-
76
-
77
-
78
-
79
-
80
-
81
-
82
-
83
-
84
-
85
-
86
-
87
-
88
-
89
-
90
-
91
-
 92
92 -
 93
93 -
 94
94 -
 95
95 -
 96
96 -
 97
97 -
 98
98 -
 99
99 -
 100
100 -
 101
101 -
 102
102 -
 103
103 -
 104
104 -
 105
105 -
 106
106 -
 107
107 -
 108
108 -
 109
109 -
 110
110 -
 111
111 -
 112
112 -
113
-
114
-
115
-
116
-
117
-
118
-
119
-
120
-
121
-
122
-
123
-
124
-
125
-
126
-
127
-
128
-
129
-
130
-
131
-
132
-
133
-
134
-
135
-
136
-
137
-
138
-
139
-
140
-
141
-
142
-
143
-
144
-
145
-
146
-
147
-
148
-
149
-
150
-
151
-
152
-
153
-
154
-
155
-
156
-
157
-
158
-
159
-
160
-
161
-
162
-
163
-
164
-
165
-
166
-
167
-
168
-
169
-
170
-
171
-
172
-
173
-
174
-
175
-
176
-
177
-
178
-
179
-
180
-
181
-
182
-
183
-
184
-
185
-
186
-
187
-
188
-
189
-
190
-
191
-
192
-
193
-
194
-
195
-
196
-
197
-
198
-
199
-
200
-
201
-
202
-
203
-
204
-
205
-
206
-
207
-
208
-
209
-
210
-
211
-
212
-
213
-
214
-
215
-
216
-
217
-
218
-
219
-
220
-
221
-
222
-
223
-
224
-
225
-
226
-
227
-
228
-
229
-
230
-
231
-
232
-
233
-
234
-
235
-
236
-
237
-
238
-
239
-
240
-
241
-
242
-
243
-
244
-
245
-
246
-
247
-
248
-
249
-
250
-
251
-
252
-
253
-
254
-
255
-
256
-
257
-
258
-
259
-
260
-
261
-
262
-
263
-
264
-
265
-
266
 |
 |

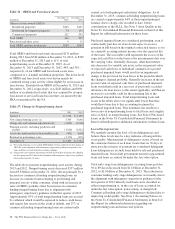
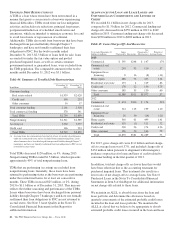
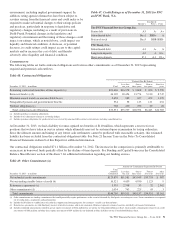
Table 46: Allowance for Loan and Lease Losses
Dollars in millions 2013 2012
January 1 $ 4,036 $ 4,347
Total net charge-offs (1,077) (1,289)
Provision for credit losses 643 987
Net change in allowance for unfunded loan
commitments and letters of credit 8 (10)
Other (1) 1
December 31 $ 3,609 $ 4,036
Net charge-offs to average loans (for the
year ended) (a) .57% .73%
Allowance for loan and lease losses to total
loans 1.84 2.17
Commercial lending net charge-offs $ (249) $ (359)
Consumer lending net charge-offs (828) (930)
Total net charge-offs $(1,077) $(1,289)
Net charge-offs to average loans (for the
year ended)
Commercial lending .22% .35%
Consumer lending (a) 1.07 1.24
(a) Includes charge-offs of $134 million taken pursuant to alignment with interagency
guidance on practices for loans and lines of credit related to consumer lending in the
first quarter of 2013.
The provision for credit losses totaled $643 million for 2013
compared to $987 million for 2012. The primary driver of the
decrease to the provision was improved overall credit quality,
including improved commercial loan risk factors, lower
consumer loan delinquencies and improvements in expected cash
flows for our purchased impaired loans. For 2013, the provision
for commercial lending credit losses decreased by $102 million,
or 74%, from 2012. The provision for consumer lending credit
losses decreased $242 million, or 29%, from 2012.
At December 31, 2013, total ALLL to total nonperforming
loans was 117%. The comparable amount for December 31,
2012 was 124%. These ratios are 72% and 79%, respectively,
when excluding the $1.4 billion and $1.5 billion, respectively,
of ALLL at December 31, 2013 and December 31, 2012
allocated to consumer loans and lines of credit not secured by
residential real estate and purchased impaired loans. We have
excluded consumer loans and lines of credit not secured by
real estate as they are charged off after 120 to 180 days past
due and not placed on nonperforming status. Additionally, we
have excluded purchased impaired loans as they are
considered performing regardless of their delinquency status
as interest is accreted based on our estimate of expected cash
flows and additional allowance is recorded when these cash
flows are below recorded investment. See Table 35 within this
Credit Risk Management section for additional information.
The ALLL balance increases or decreases across periods in
relation to fluctuating risk factors, including asset quality
trends, charge-offs and changes in aggregate portfolio
balances. During 2013, improving asset quality trends,
including, but not limited to, delinquency status and
improving economic conditions, realization of previously
estimated losses through charge-offs, including the impact of
alignment with interagency guidance and overall portfolio
growth, combined to result in the ALLL balance declining $.4
billion, or 11% to $3.6 billion as of December 31, 2013
compared to December 31, 2012.
See Note 7 Allowances for Loan and Lease Losses and
Unfunded Loan Commitments and Letters of Credit and Note
6 Purchased Loans in the Notes To Consolidated Financial
Statements in Item 8 of this Report regarding changes in the
ALLL and in the allowance for unfunded loan commitments
and letters of credit.
O
PERATIONAL
R
ISK
M
ANAGEMENT
Operational risk is the risk of loss resulting from inadequate or
failed internal processes or systems, human factors, or external
events. This includes losses that may arise as a result of non-
compliance with laws or regulations, failure to fulfill fiduciary
responsibilities, as well as litigation or other legal actions.
Operational risk may occur in any of our business activities and
manifests itself in various ways, including but not limited to:
• Transaction processing errors,
• Unauthorized transactions and fraud by employees or
third parties,
• Material disruption in business activities,
• System breaches and misuse of sensitive information,
• Regulatory or governmental actions, fines or
penalties, and
• Significant legal expenses, judgments or settlements.
PNC’s Operational Risk Management is inclusive of
Technology Risk Management, Compliance and Business
Continuity Risk. Operational Risk Management focuses on
balancing business needs, regulatory expectations and risk
management priorities through an adaptive and proactive
program that is designed to provide a strong governance
model, sound and consistent risk management processes and
transparent operational risk reporting across the enterprise.
The PNC Board determines the strategic approach to
operational risk via establishment of the operational risk
appetite and appropriate risk management structure. This
includes establishment of risk metrics and limits and a
reporting structure to identify, understand and manage
operational risks.
Executive Management has responsibility for operational risk
management. The executive management team is responsible
for monitoring significant risks, key controls and related
issues through management reporting and a governance
structure of risk committees and sub-committees.
Within Risk Management, Operational Risk Management
functions are responsible for developing and maintaining the
84 The PNC Financial Services Group, Inc. – Form 10-K