PNC Bank 2013 Annual Report Download - page 115
Download and view the complete annual report
Please find page 115 of the 2013 PNC Bank annual report below. You can navigate through the pages in the report by either clicking on the pages listed below, or by using the keyword search tool below to find specific information within the annual report.-
 1
1 -
2
-
3
-
4
-
5
-
6
-
7
-
8
-
9
-
10
-
11
-
12
-
13
-
14
-
15
-
16
-
17
-
18
-
19
-
20
-
21
-
22
-
23
-
24
-
25
-
26
-
27
-
28
-
29
-
30
-
31
-
32
-
33
-
34
-
35
-
36
-
37
-
38
-
39
-
40
-
41
-
42
-
43
-
44
-
45
-
46
-
47
-
48
-
49
-
50
-
51
-
52
-
53
-
54
-
55
-
56
-
57
-
58
-
59
-
60
-
61
-
62
-
63
-
64
-
65
-
66
-
67
-
68
-
69
-
70
-
71
-
72
-
73
-
74
-
75
-
76
-
77
-
78
-
79
-
80
-
81
-
82
-
83
-
84
-
85
-
86
-
87
-
88
-
89
-
90
-
91
-
92
-
93
-
94
-
95
-
96
-
97
-
98
-
99
-
100
-
101
-
102
-
103
-
104
-
 105
105 -
 106
106 -
 107
107 -
 108
108 -
 109
109 -
 110
110 -
 111
111 -
 112
112 -
 113
113 -
 114
114 -
 115
115 -
 116
116 -
 117
117 -
 118
118 -
 119
119 -
 120
120 -
 121
121 -
 122
122 -
 123
123 -
 124
124 -
 125
125 -
126
-
127
-
128
-
129
-
130
-
131
-
132
-
133
-
134
-
135
-
136
-
137
-
138
-
139
-
140
-
141
-
142
-
143
-
144
-
145
-
146
-
147
-
148
-
149
-
150
-
151
-
152
-
153
-
154
-
155
-
156
-
157
-
158
-
159
-
160
-
161
-
162
-
163
-
164
-
165
-
166
-
167
-
168
-
169
-
170
-
171
-
172
-
173
-
174
-
175
-
176
-
177
-
178
-
179
-
180
-
181
-
182
-
183
-
184
-
185
-
186
-
187
-
188
-
189
-
190
-
191
-
192
-
193
-
194
-
195
-
196
-
197
-
198
-
199
-
200
-
201
-
202
-
203
-
204
-
205
-
206
-
207
-
208
-
209
-
210
-
211
-
212
-
213
-
214
-
215
-
216
-
217
-
218
-
219
-
220
-
221
-
222
-
223
-
224
-
225
-
226
-
227
-
228
-
229
-
230
-
231
-
232
-
233
-
234
-
235
-
236
-
237
-
238
-
239
-
240
-
241
-
242
-
243
-
244
-
245
-
246
-
247
-
248
-
249
-
250
-
251
-
252
-
253
-
254
-
255
-
256
-
257
-
258
-
259
-
260
-
261
-
262
-
263
-
264
-
265
-
266
 |
 |
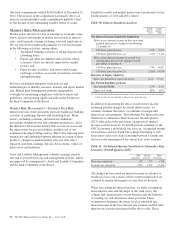
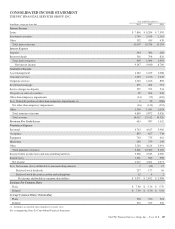
Residential mortgage revenue decreased to $284 million in
2012 from $713 million in 2011. This decrease of $429
million was largely due to a higher provision for residential
mortgage repurchase obligations of $761 million in 2012
compared with $102 million in 2011, partially offset by an
increase in loan sales revenue driven by higher loan
origination volume.
The higher provision for residential mortgage repurchase
obligations in 2012 reflected expected further elevated levels
of repurchase demands primarily as a result of changes in
behaviors and demand patterns of two government-sponsored
enterprises, FHLMC and FNMA, for loans sold into Agency
securitizations. The recorded liability for residential mortgage
indemnification and repurchase claims was $614 million at
December 31, 2012. See the Recourse And Repurchase
Obligations section of this Item 7 and in Item 7 in our 2012
Form 10-K for more detail.
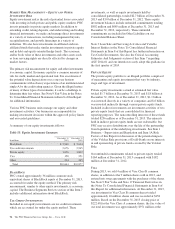
Service charges on deposits grew to $573 million in 2012
compared with $534 million in 2011. This increase reflected
continued success in growing customers, including through
the RBC Bank (USA) acquisition.
Net gains on sales of securities totaled $204 million for 2012
and $249 million for 2011. The net credit component of other-
than-temporary impairment (OTTI) of securities recognized in
earnings was $111 million in 2012 compared with $152
million for 2011.
Other noninterest income increased by $.4 billion, to $1.5
billion for 2012 compared with 2011. This increase was
primarily due to $267 million of gains on sales of
approximately 9 million Visa Class B common shares during
the third and fourth quarters of 2012, as well as higher
revenue associated with private equity investments. We held
approximately 14.4 million Visa Class B common shares with
an estimated fair value of approximately $916 million as of
December 31, 2012. Our recorded investment in those
remaining shares was approximately $251 million at
December 31, 2012. The impacts to other noninterest income
from credit valuations for customer-related derivatives
activities were not significant in both 2012 and 2011.
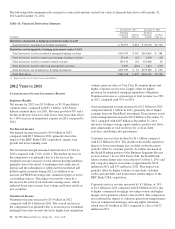
Provision For Credit Losses
The provision for credit losses totaled $1.0 billion for 2012, a
decrease of $.2 billion, or 14%, compared with $1.2 billion for
2011. The decline in the comparison was driven by overall
credit quality improvement.
Noninterest Expense
Noninterest expense was $10.6 billion for 2012 and $9.1
billion for 2011. Noninterest expense for 2012 included
noncash charges of $295 million related to redemption of trust
preferred securities, integration costs of $267 million, $225
million of residential mortgage foreclosure-related expenses,
and a noncash charge of $45 million for residential mortgage
banking goodwill impairment. Noninterest expense for 2011
included $324 million of residential mortgage foreclosure-
related expenses, $198 million of noncash charges related to
redemption of trust preferred securities and $42 million of
integration costs. The increase in noninterest expense in 2012
compared with 2011 also reflected operating expense for the
RBC Bank (USA) acquisition, higher personnel expense,
higher settlements for other litigation and increased expenses
for other real estate owned.
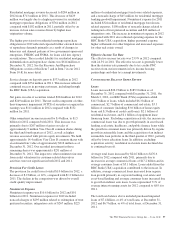
Effective Income Tax Rate
The effective income tax rate was 23.9% in 2012 compared
with 24.5% in 2011. The effective tax rate is generally lower
than the statutory rate primarily due to tax credits PNC
receives from our investments in low income housing
partnerships and other tax exempt investments.
C
ONSOLIDATED
B
ALANCE
S
HEET
R
EVIEW
Loans
Loans increased $26.9 billion to $185.9 billion as of
December 31, 2012 compared with December 31, 2011. On
March 2, 2012, our RBC Bank (USA) acquisition added
$14.5 billion of loans, which included $6.3 billion of
commercial, $2.7 billion of commercial real estate, $3.3
billion of consumer (including $3.0 billion of home equity
loans and $.3 billion of credit card loans), $2.1 billion of
residential real estate, and $.1 billion of equipment lease
financing loans. Excluding acquisition activity, the increase in
commercial loans was due to growth primarily in asset-based
lending, real estate, healthcare, and public finance loans while
the growth in consumer loans was primarily driven by organic
growth in automobile loans and the acquisition of an indirect
automobile loan portfolio in the third quarter of 2012, partially
offset by lower education loans. In addition, excluding
acquisition activity, residential real estate loans declined due
to continued run-off.
Average total loans increased by $24.6 billion to $176.6
billion for 2012 compared with 2011, primarily due to
increases in average commercial loans of $17.2 billion and in
average consumer loans of $5.1 billion. Loans added from the
RBC Bank (USA) acquisition contributed to the increase. In
addition, average commercial loans increased from organic
loan growth primarily in corporate banking, real estate and
asset-based lending and average consumer loans increased due
to growth in indirect auto loans. Loans represented 71% of
average interest-earning assets for 2012 compared to 68% for
2011.
The total loan balance above included purchased impaired
loans of $7.4 billion, or 4% of total loans, at December 31,
2012 and $6.7 billion, or 4% of total loans, at December 31,
2011.
The PNC Financial Services Group, Inc. – Form 10-K 97