PNC Bank 2013 Annual Report Download - page 246
Download and view the complete annual report
Please find page 246 of the 2013 PNC Bank annual report below. You can navigate through the pages in the report by either clicking on the pages listed below, or by using the keyword search tool below to find specific information within the annual report.-
 1
1 -
2
-
3
-
4
-
5
-
6
-
7
-
8
-
9
-
10
-
11
-
12
-
13
-
14
-
15
-
16
-
17
-
18
-
19
-
20
-
21
-
22
-
23
-
24
-
25
-
26
-
27
-
28
-
29
-
30
-
31
-
32
-
33
-
34
-
35
-
36
-
37
-
38
-
39
-
40
-
41
-
42
-
43
-
44
-
45
-
46
-
47
-
48
-
49
-
50
-
51
-
52
-
53
-
54
-
55
-
56
-
57
-
58
-
59
-
60
-
61
-
62
-
63
-
64
-
65
-
66
-
67
-
68
-
69
-
70
-
71
-
72
-
73
-
74
-
75
-
76
-
77
-
78
-
79
-
80
-
81
-
82
-
83
-
84
-
85
-
86
-
87
-
88
-
89
-
90
-
91
-
92
-
93
-
94
-
95
-
96
-
97
-
98
-
99
-
100
-
101
-
102
-
103
-
104
-
105
-
106
-
107
-
108
-
109
-
110
-
111
-
112
-
113
-
114
-
115
-
116
-
117
-
118
-
119
-
120
-
121
-
122
-
123
-
124
-
125
-
126
-
127
-
128
-
129
-
130
-
131
-
132
-
133
-
134
-
135
-
136
-
137
-
138
-
139
-
140
-
141
-
142
-
143
-
144
-
145
-
146
-
147
-
148
-
149
-
150
-
151
-
152
-
153
-
154
-
155
-
156
-
157
-
158
-
159
-
160
-
161
-
162
-
163
-
164
-
165
-
166
-
167
-
168
-
169
-
170
-
171
-
172
-
173
-
174
-
175
-
176
-
177
-
178
-
179
-
180
-
181
-
182
-
183
-
184
-
185
-
186
-
187
-
188
-
189
-
190
-
191
-
192
-
193
-
194
-
195
-
196
-
197
-
198
-
199
-
200
-
201
-
202
-
203
-
204
-
205
-
206
-
207
-
208
-
209
-
210
-
211
-
212
-
213
-
214
-
215
-
216
-
217
-
218
-
219
-
220
-
221
-
222
-
223
-
224
-
225
-
226
-
227
-
228
-
229
-
230
-
231
-
232
-
233
-
234
-
235
-
 236
236 -
 237
237 -
 238
238 -
 239
239 -
 240
240 -
 241
241 -
 242
242 -
 243
243 -
 244
244 -
 245
245 -
 246
246 -
 247
247 -
 248
248 -
 249
249 -
 250
250 -
 251
251 -
 252
252 -
 253
253 -
 254
254 -
 255
255 -
 256
256 -
257
-
258
-
259
-
260
-
261
-
262
-
263
-
264
-
265
-
266
 |
 |

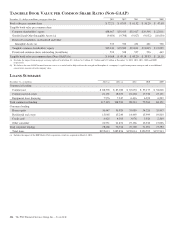
S
UMMARY OF
L
OAN
L
OSS
E
XPERIENCE
Year ended December 31 – dollars in millions 2013 2012 2011 2010 2009
Allowance for loan and lease losses – January 1 $ 4,036 $ 4,347 $ 4,887 $ 5,072 $ 3,917
Charge-offs
Commercial (395) (474) (700) (1,227) (1,276)
Commercial real estate (203) (314) (464) (670) (510)
Equipment lease financing (8) (16) (35) (120) (149)
Consumer (a) (849) (956) (912) (1,069) (961)
Residential real estate (133) (110) (153) (406) (259)
Total charge-offs (1,588) (1,870) (2,264) (3,492) (3,155)
Recoveries
Commercial 248 300 332 294 181
Commercial real estate 93 115 105 77 38
Equipment lease financing 16 30 50 56 27
Consumer (a) 150 137 127 110 105
Residential real estate 4 (1) 11 19 93
Total recoveries 511 581 625 556 444
Net charge-offs (1,077) (1,289) (1,639) (2,936) (2,711)
Provision for credit losses 643 987 1,152 2,502 3,930
Net change in allowance for unfunded loan commitments and letters of credit 8 (10) (52) 108 48
Acquired allowance – National City (112)
Adoption of ASU 2009-17, Consolidations 141
Other (1) 1 (1)
Allowance for loan and lease losses – December 31 $ 3,609 $ 4,036 $ 4,347 $ 4,887 $ 5,072
Allowance as a percent of December 31:
Loans 1.84% 2.17% 2.73% 3.25% 3.22%
Nonperforming loans 117 124 122 109 89
As a percent of average loans
Net charge-offs .57 .73 1.08 1.91 1.64
Provision for credit losses .34 .56 .76 1.63 2.37
Allowance for loan and lease losses 1.90 2.28 2.86 3.18 3.06
Allowance as a multiple of net charge-offs 3.35x 3.13x 2.65x 1.66x 1.87x
(a) Includes home equity, credit card and other consumer.
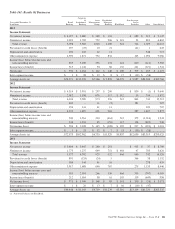
The following table presents the assignment of the allowance for loan and lease losses and the categories of loans as a percentage
of total loans. Changes in the allocation over time reflect the changes in loan portfolio composition, risk profile and refinements to
reserve methodologies.
A
LLOCATION OF
A
LLOWANCE FOR
L
OAN AND
L
EASE
L
OSSES
2013 2012 2011 2010 2009
December 31
Dollars in millions Allowance
Loans to
Total Loans Allowance
Loans to
Total Loans Allowance
Loans to
Total Loans Allowance
Loans to
Total Loans Allowance
Loans to
Total Loans
Commercial $1,100 45.2% $1,131 44.7% $1,180 41.3% $1,387 36.7% $1,869 34.8%
Commercial real estate 400 10.8 589 10.0 753 10.2 1,086 11.9 1,305 14.7
Equipment lease
financing 47 3.9 54 3.9 62 4.0 94 4.2 171 3.9
Consumer (a) 1,420 32.4 1,415 33.2 1,458 35.4 1,227 36.6 957 34.0
Residential real estate 642 7.7 847 8.2 894 9.1 1,093 10.6 770 12.6
Total $3,609 100.0% $4,036 100.0% $4,347 100.0% $4,887 100.0% $5,072 100.0%
(a) Includes home equity, credit card and other consumer.
228 The PNC Financial Services Group, Inc. – Form 10-K