PNC Bank 2013 Annual Report Download - page 166
Download and view the complete annual report
Please find page 166 of the 2013 PNC Bank annual report below. You can navigate through the pages in the report by either clicking on the pages listed below, or by using the keyword search tool below to find specific information within the annual report.-
 1
1 -
2
-
3
-
4
-
5
-
6
-
7
-
8
-
9
-
10
-
11
-
12
-
13
-
14
-
15
-
16
-
17
-
18
-
19
-
20
-
21
-
22
-
23
-
24
-
25
-
26
-
27
-
28
-
29
-
30
-
31
-
32
-
33
-
34
-
35
-
36
-
37
-
38
-
39
-
40
-
41
-
42
-
43
-
44
-
45
-
46
-
47
-
48
-
49
-
50
-
51
-
52
-
53
-
54
-
55
-
56
-
57
-
58
-
59
-
60
-
61
-
62
-
63
-
64
-
65
-
66
-
67
-
68
-
69
-
70
-
71
-
72
-
73
-
74
-
75
-
76
-
77
-
78
-
79
-
80
-
81
-
82
-
83
-
84
-
85
-
86
-
87
-
88
-
89
-
90
-
91
-
92
-
93
-
94
-
95
-
96
-
97
-
98
-
99
-
100
-
101
-
102
-
103
-
104
-
105
-
106
-
107
-
108
-
109
-
110
-
111
-
112
-
113
-
114
-
115
-
116
-
117
-
118
-
119
-
120
-
121
-
122
-
123
-
124
-
125
-
126
-
127
-
128
-
129
-
130
-
131
-
132
-
133
-
134
-
135
-
136
-
137
-
138
-
139
-
140
-
141
-
142
-
143
-
144
-
145
-
146
-
147
-
148
-
149
-
150
-
151
-
152
-
153
-
154
-
155
-
 156
156 -
 157
157 -
 158
158 -
 159
159 -
 160
160 -
 161
161 -
 162
162 -
 163
163 -
 164
164 -
 165
165 -
 166
166 -
 167
167 -
 168
168 -
 169
169 -
 170
170 -
 171
171 -
 172
172 -
 173
173 -
 174
174 -
 175
175 -
 176
176 -
177
-
178
-
179
-
180
-
181
-
182
-
183
-
184
-
185
-
186
-
187
-
188
-
189
-
190
-
191
-
192
-
193
-
194
-
195
-
196
-
197
-
198
-
199
-
200
-
201
-
202
-
203
-
204
-
205
-
206
-
207
-
208
-
209
-
210
-
211
-
212
-
213
-
214
-
215
-
216
-
217
-
218
-
219
-
220
-
221
-
222
-
223
-
224
-
225
-
226
-
227
-
228
-
229
-
230
-
231
-
232
-
233
-
234
-
235
-
236
-
237
-
238
-
239
-
240
-
241
-
242
-
243
-
244
-
245
-
246
-
247
-
248
-
249
-
250
-
251
-
252
-
253
-
254
-
255
-
256
-
257
-
258
-
259
-
260
-
261
-
262
-
263
-
264
-
265
-
266
 |
 |

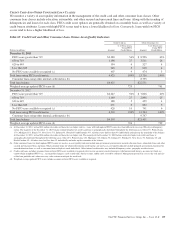
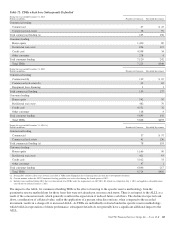
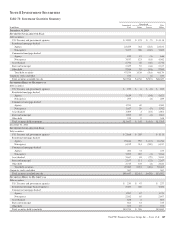
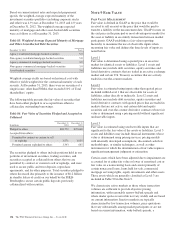
Table 76: Rollforward of Allowance for Loan and Lease Losses and Associated Loan Data
(continued from previous page)
In millions
Commercial
Lending
Consumer
Lending Total
December 31, 2011
Allowance for Loan and Lease Losses
January 1 $ 2,567 $ 2,320 $ 4,887
Charge-offs (1,199) (1,065) (2,264)
Recoveries 487 138 625
Net charge-offs (712) (927) (1,639)
Provision for credit losses 177 975 1,152
Net change in allowance for unfunded loan commitments and letters of credit (36) (16) (52)
Other (1) (1)
December 31 $ 1,995 $ 2,352 $ 4,347
TDRs individually evaluated for impairment $ 39 $ 541 $ 580
Other loans individually evaluated for impairment 520 520
Loans collectively evaluated for impairment 1,207 1,042 2,249
Purchased impaired loans 229 769 998
December 31 $ 1,995 $ 2,352 $ 4,347
Loan Portfolio
TDRs individually evaluated for impairment $ 405 $ 1,798 $ 2,203
Other loans individually evaluated for impairment 1,890 1,890
Loans collectively evaluated for impairment 85,167 63,087 148,254
Purchased impaired loans 852 5,815 6,667
December 31 $88,314 $70,700 $159,014
Portfolio segment ALLL as a percentage of total ALLL 46% 54% 100%
Ratio of the allowance for loan and lease losses to total loans 2.26% 3.33% 2.73%
(a) Includes $252 million of loans collectively evaluated for impairment based upon collateral values and written down to the respective collateral value less costs to sell. Accordingly,
there is no allowance recorded for these loans.
Net interest income less the provision for credit losses was $8.5 billion for 2013 compared with $8.7 billion for 2012 and $7.5
billion for 2011.
A
LLOWANCE
F
OR
U
NFUNDED
L
OAN
C
OMMITMENTS
A
ND
L
ETTERS
O
F
C
REDIT
We maintain the allowance for unfunded loan commitments and letters of credit at a level we believe is appropriate to absorb
estimated probable credit losses on these unfunded credit facilities as of the balance sheet date. See Note 1 Accounting Policies for
additional information.
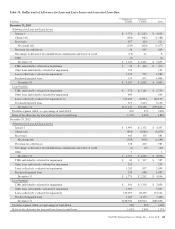
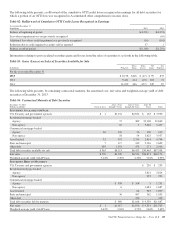
Table 77: Rollforward of Allowance for Unfunded Loan Commitments and Letters of Credit
In millions 2013 2012 2011
January 1 $250 $240 $188
Net change in allowance for unfunded loan commitments and letters of credit (8) 10 52
December 31 $242 $250 $240
148 The PNC Financial Services Group, Inc. – Form 10-K