PNC Bank 2013 Annual Report Download - page 52
Download and view the complete annual report
Please find page 52 of the 2013 PNC Bank annual report below. You can navigate through the pages in the report by either clicking on the pages listed below, or by using the keyword search tool below to find specific information within the annual report.-
 1
1 -
2
-
3
-
4
-
5
-
6
-
7
-
8
-
9
-
10
-
11
-
12
-
13
-
14
-
15
-
16
-
17
-
18
-
19
-
20
-
21
-
22
-
23
-
24
-
25
-
26
-
27
-
28
-
29
-
30
-
31
-
32
-
33
-
34
-
35
-
36
-
37
-
38
-
39
-
40
-
41
-
 42
42 -
 43
43 -
 44
44 -
 45
45 -
 46
46 -
 47
47 -
 48
48 -
 49
49 -
 50
50 -
 51
51 -
 52
52 -
 53
53 -
 54
54 -
 55
55 -
 56
56 -
 57
57 -
 58
58 -
 59
59 -
 60
60 -
 61
61 -
 62
62 -
63
-
64
-
65
-
66
-
67
-
68
-
69
-
70
-
71
-
72
-
73
-
74
-
75
-
76
-
77
-
78
-
79
-
80
-
81
-
82
-
83
-
84
-
85
-
86
-
87
-
88
-
89
-
90
-
91
-
92
-
93
-
94
-
95
-
96
-
97
-
98
-
99
-
100
-
101
-
102
-
103
-
104
-
105
-
106
-
107
-
108
-
109
-
110
-
111
-
112
-
113
-
114
-
115
-
116
-
117
-
118
-
119
-
120
-
121
-
122
-
123
-
124
-
125
-
126
-
127
-
128
-
129
-
130
-
131
-
132
-
133
-
134
-
135
-
136
-
137
-
138
-
139
-
140
-
141
-
142
-
143
-
144
-
145
-
146
-
147
-
148
-
149
-
150
-
151
-
152
-
153
-
154
-
155
-
156
-
157
-
158
-
159
-
160
-
161
-
162
-
163
-
164
-
165
-
166
-
167
-
168
-
169
-
170
-
171
-
172
-
173
-
174
-
175
-
176
-
177
-
178
-
179
-
180
-
181
-
182
-
183
-
184
-
185
-
186
-
187
-
188
-
189
-
190
-
191
-
192
-
193
-
194
-
195
-
196
-
197
-
198
-
199
-
200
-
201
-
202
-
203
-
204
-
205
-
206
-
207
-
208
-
209
-
210
-
211
-
212
-
213
-
214
-
215
-
216
-
217
-
218
-
219
-
220
-
221
-
222
-
223
-
224
-
225
-
226
-
227
-
228
-
229
-
230
-
231
-
232
-
233
-
234
-
235
-
236
-
237
-
238
-
239
-
240
-
241
-
242
-
243
-
244
-
245
-
246
-
247
-
248
-
249
-
250
-
251
-
252
-
253
-
254
-
255
-
256
-
257
-
258
-
259
-
260
-
261
-
262
-
263
-
264
-
265
-
266
 |
 |

A
VERAGE
C
ONSOLIDATED
B
ALANCE
S
HEET
H
IGHLIGHTS
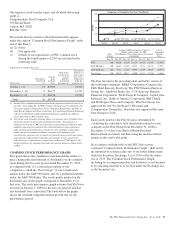
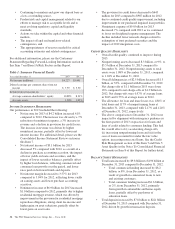
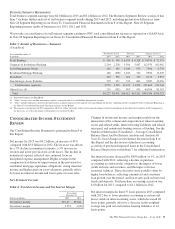
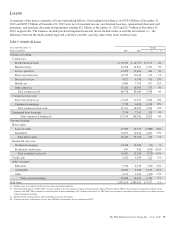
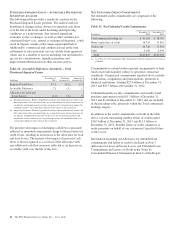
Table 2: Summarized Average Balance Sheet
Year ended December 31 Change
Dollars in millions 2013 2012 $ %
Average assets
Interest-earning assets
Investment securities $ 57,319 $ 60,816 $ (3,497) (6)%
Loans 189,973 176,618 13,355 8%
Other 13,353 11,120 2,233 20%
Total interest-earning assets 260,645 248,554 12,091 5%
Noninterest-earning assets 45,121 46,471 (1,350) (3)%
Total average assets $305,766 $295,025 $10,741 4%
Average liabilities and equity
Interest-bearing liabilities
Interest-bearing deposits $146,000 $139,942 $ 6,058 4%
Borrowed funds 40,022 41,844 (1,822) (4)%
Total interest-bearing liabilities 186,022 181,786 4,236 2%
Noninterest-bearing deposits 66,168 61,610 4,558 7%
Other liabilities 11,202 11,587 (385) (3)%
Equity 42,374 40,042 2,332 6%
Total average liabilities and equity $305,766 $295,025 $10,741 4%
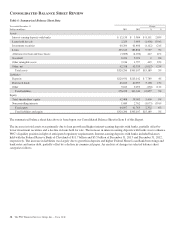
Total assets were $320.3 billion at December 31, 2013
compared with $305.1 billion at December 31, 2012. The
increase from year end 2012 was primarily due to loan growth
and higher interest-earning deposits with banks, partially
offset by lower investment securities and a decline in loans
held for sale.
Various seasonal and other factors impact our period-end
balances, whereas average balances are generally more
indicative of underlying business trends apart from the impact
of acquisitions and divestitures. The Consolidated Balance
Sheet Review section of this Item 7 provides information on
changes in selected Consolidated Balance Sheet categories at
December 31, 2013 compared with December 31, 2012.
The increase in total average assets in the comparison of 2013
to 2012 was primarily due to an increase in average total loans.
The increase in average loans in 2013 was driven by increases
in average commercial loans of $9.4 billion, average
consumer loans of $2.4 billion and average commercial real
estate loans of $1.4 billion. The overall increase in loans
reflected organic loan growth, primarily in our Corporate &
Institutional Banking segment.
Loans represented 73% of average interest-earning assets for
2013 and 71% of average interest-earning assets for 2012.
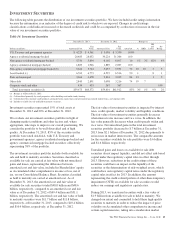
Average investment securities decreased during 2013
compared with 2012 primarily as a result of principal
payments, including prepayments and maturities, partially
offset by net purchase activity. Total investment securities
comprised 22% of average interest-earning assets in 2013 and
24% in 2012.
Average noninterest-earning assets decreased in 2013
compared with 2012, primarily reflecting decreased unsettled
securities sales, which are included in noninterest-earning
assets for average balance sheet purposes.
Average total deposits increased $10.6 billion in 2013
compared with the prior year, primarily due to an increase of
$15.0 billion in average transaction deposits, which grew to
$176.9 billion in 2013. Higher average interest-bearing
demand deposits, average money market deposits and average
noninterest-bearing deposits drove the increase in average
transaction deposits. These increases were partially offset by a
decrease of $4.3 billion in average retail certificates of deposit
attributable to runoff of maturing accounts. Total deposits at
December 31, 2013 were $220.9 billion compared with $213.1
billion at December 31, 2012 and are further discussed within
the Consolidated Balance Sheet Review section of this Item 7.
Average total deposits represented 69% of average total assets
for 2013 and 68% for 2012.
The decrease in average borrowed funds in 2013 compared
with 2012 was primarily due to lower average commercial
paper, lower average Federal Home Loan Bank (FHLB)
borrowings and lower average federal funds purchased and
repurchase agreements. Total borrowed funds at December 31,
2013 were $46.1 billion compared with $40.9 billion at
December 31, 2012 and are further discussed within the
Consolidated Balance Sheet Review section of this Item 7.
The Liquidity Risk Management portion of the Risk
Management section of this Item 7 includes additional
information regarding our borrowed funds.
34 The PNC Financial Services Group, Inc. – Form 10-K