PNC Bank 2013 Annual Report Download - page 79
Download and view the complete annual report
Please find page 79 of the 2013 PNC Bank annual report below. You can navigate through the pages in the report by either clicking on the pages listed below, or by using the keyword search tool below to find specific information within the annual report.-
 1
1 -
2
-
3
-
4
-
5
-
6
-
7
-
8
-
9
-
10
-
11
-
12
-
13
-
14
-
15
-
16
-
17
-
18
-
19
-
20
-
21
-
22
-
23
-
24
-
25
-
26
-
27
-
28
-
29
-
30
-
31
-
32
-
33
-
34
-
35
-
36
-
37
-
38
-
39
-
40
-
41
-
42
-
43
-
44
-
45
-
46
-
47
-
48
-
49
-
50
-
51
-
52
-
53
-
54
-
55
-
56
-
57
-
58
-
59
-
60
-
61
-
62
-
63
-
64
-
65
-
66
-
67
-
68
-
 69
69 -
 70
70 -
 71
71 -
 72
72 -
 73
73 -
 74
74 -
 75
75 -
 76
76 -
 77
77 -
 78
78 -
 79
79 -
 80
80 -
 81
81 -
 82
82 -
 83
83 -
 84
84 -
 85
85 -
 86
86 -
 87
87 -
 88
88 -
 89
89 -
90
-
91
-
92
-
93
-
94
-
95
-
96
-
97
-
98
-
99
-
100
-
101
-
102
-
103
-
104
-
105
-
106
-
107
-
108
-
109
-
110
-
111
-
112
-
113
-
114
-
115
-
116
-
117
-
118
-
119
-
120
-
121
-
122
-
123
-
124
-
125
-
126
-
127
-
128
-
129
-
130
-
131
-
132
-
133
-
134
-
135
-
136
-
137
-
138
-
139
-
140
-
141
-
142
-
143
-
144
-
145
-
146
-
147
-
148
-
149
-
150
-
151
-
152
-
153
-
154
-
155
-
156
-
157
-
158
-
159
-
160
-
161
-
162
-
163
-
164
-
165
-
166
-
167
-
168
-
169
-
170
-
171
-
172
-
173
-
174
-
175
-
176
-
177
-
178
-
179
-
180
-
181
-
182
-
183
-
184
-
185
-
186
-
187
-
188
-
189
-
190
-
191
-
192
-
193
-
194
-
195
-
196
-
197
-
198
-
199
-
200
-
201
-
202
-
203
-
204
-
205
-
206
-
207
-
208
-
209
-
210
-
211
-
212
-
213
-
214
-
215
-
216
-
217
-
218
-
219
-
220
-
221
-
222
-
223
-
224
-
225
-
226
-
227
-
228
-
229
-
230
-
231
-
232
-
233
-
234
-
235
-
236
-
237
-
238
-
239
-
240
-
241
-
242
-
243
-
244
-
245
-
246
-
247
-
248
-
249
-
250
-
251
-
252
-
253
-
254
-
255
-
256
-
257
-
258
-
259
-
260
-
261
-
262
-
263
-
264
-
265
-
266
 |
 |
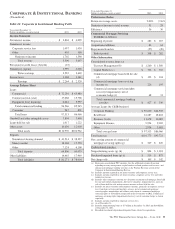
This business segment consists primarily of non-strategic assets
obtained through acquisitions of other companies. The business
activity of this segment is to manage the wind-down of the
portfolio while maximizing the value and mitigating risk. In
March 2012, RBC Bank (USA) was acquired, which added
approximately $1.0 billion of residential real estate loans, $.2
billion of commercial/commercial real estate loans and $.2
billion of OREO assets as of the acquisition date. Of these
assets, $1.0 billion were deemed purchased impaired loans.
Non-Strategic Assets Portfolio had earnings of $379 million in
2013 compared with $237 million in 2012. Earnings increased
year-over-year due to lower provision for credit losses and
lower noninterest expense, partially offset by lower net
interest income.
Non-Strategic Assets Portfolio overview:
• Net interest income was $689 million in 2013
compared with $830 million in 2012. The decrease
was driven by lower purchase accounting accretion
as well as lower average loan balances.
• Noninterest income was $53 million in 2013
compared with $13 million in 2012. The increase was
driven by lower provision for estimated losses on
home equity repurchase obligations.
• The 2013 period reflected a benefit from the
provision for credit losses of $21 million compared to
an expense of $181 million in 2012 primarily due to
the increasing value of residential real estate.
• Noninterest expense in 2013 was $163 million
compared with $287 million in 2012. The decrease
was driven by lower commercial OREO write-downs
and lower shared service expenses on consumer loans.
• Average portfolio loans declined to $10.7 billion in
2013 compared with $12.4 billion in 2012. The
overall decline was driven by customer payment
activity and portfolio management activities to
reduce under-performing assets, partially offset by
the addition of loans from the March 2012 RBC
Bank (USA) acquisition.
• Nonperforming loans were $.7 billion at
December 31, 2013 and December 31, 2012. The
consumer lending portfolio comprised 90% of the
nonperforming loans in this segment at December 31,
2013. Nonperforming consumer loans increased $28
million from December 31, 2012, due to alignment
with interagency guidance in the first quarter of
2013. The commercial lending portfolio comprised
10% of the nonperforming loans as of December 31,
2013. Nonperforming commercial loans decreased
$71 million from December 31, 2012 due to
improved credit quality.
• Net charge-offs declined from $299 million in 2012
to $172 million in 2013 primarily due to lower
charge-offs on home equity loans.
• At December 31, 2013, the liability for estimated
losses on repurchase and indemnification claims for
the Non-Strategic Assets Portfolio was $22 million
compared to $58 million at December 31, 2012. See
the Recourse and Repurchase Obligations section of
this Item 7 and Note 24 Commitments and
Guarantees in the Notes To Consolidated Financial
Statements included in Item 8 of this Report for
additional information.
C
RITICAL
A
CCOUNTING
E
STIMATES AND
J
UDGMENTS
Our consolidated financial statements are prepared by
applying certain accounting policies. Note 1 Accounting
Policies in the Notes To Consolidated Financial Statements in
Item 8 of this Report describes the most significant accounting
policies that we use. Certain of these policies require us to
make estimates or economic assumptions that may vary under
different assumptions or conditions and such variations may
significantly affect our reported results and financial position
for the period or in future periods.
F
AIR
V
ALUE
M
EASUREMENTS
We must use estimates, assumptions, and judgments when
assets and liabilities are required to be recorded at, or adjusted
to reflect, fair value.
Assets and liabilities carried at fair value inherently result in a
higher degree of financial statement volatility. Fair values and
the information used to record valuation adjustments for certain
assets and liabilities are based on either quoted market prices or
are provided by independent third-party sources, including
appraisers and valuation specialists, when available. When such
third-party information is not available, we estimate fair value
primarily by using cash flow and other financial modeling
techniques. Changes in underlying factors, assumptions, or
estimates in any of these areas could materially impact our
future financial condition and results of operations.
PNC applies ASC 820 Fair Value Measurements and
Disclosures. This guidance defines fair value as the price that
would be received to sell a financial asset or paid to transfer a
financial liability in an orderly transaction between market
participants at the measurement date. This guidance requires a
three level hierarchy for disclosure of assets and liabilities
recorded at fair value. The classification of assets and liabilities
within the hierarchy is based on whether the inputs to the
valuation methodology used in the measurement are observable
or unobservable.
The following sections of this Report provide further
information on this type of activity:
• Fair Value Measurements included within this
Item 7, and
• Note 9 Fair Value included in the Notes To
Consolidated Financial Statements in Item 8 of this
Report.
The PNC Financial Services Group, Inc. – Form 10-K 61