PNC Bank 2013 Annual Report Download - page 188
Download and view the complete annual report
Please find page 188 of the 2013 PNC Bank annual report below. You can navigate through the pages in the report by either clicking on the pages listed below, or by using the keyword search tool below to find specific information within the annual report.-
 1
1 -
2
-
3
-
4
-
5
-
6
-
7
-
8
-
9
-
10
-
11
-
12
-
13
-
14
-
15
-
16
-
17
-
18
-
19
-
20
-
21
-
22
-
23
-
24
-
25
-
26
-
27
-
28
-
29
-
30
-
31
-
32
-
33
-
34
-
35
-
36
-
37
-
38
-
39
-
40
-
41
-
42
-
43
-
44
-
45
-
46
-
47
-
48
-
49
-
50
-
51
-
52
-
53
-
54
-
55
-
56
-
57
-
58
-
59
-
60
-
61
-
62
-
63
-
64
-
65
-
66
-
67
-
68
-
69
-
70
-
71
-
72
-
73
-
74
-
75
-
76
-
77
-
78
-
79
-
80
-
81
-
82
-
83
-
84
-
85
-
86
-
87
-
88
-
89
-
90
-
91
-
92
-
93
-
94
-
95
-
96
-
97
-
98
-
99
-
100
-
101
-
102
-
103
-
104
-
105
-
106
-
107
-
108
-
109
-
110
-
111
-
112
-
113
-
114
-
115
-
116
-
117
-
118
-
119
-
120
-
121
-
122
-
123
-
124
-
125
-
126
-
127
-
128
-
129
-
130
-
131
-
132
-
133
-
134
-
135
-
136
-
137
-
138
-
139
-
140
-
141
-
142
-
143
-
144
-
145
-
146
-
147
-
148
-
149
-
150
-
151
-
152
-
153
-
154
-
155
-
156
-
157
-
158
-
159
-
160
-
161
-
162
-
163
-
164
-
165
-
166
-
167
-
168
-
169
-
170
-
171
-
172
-
173
-
174
-
175
-
176
-
177
-
 178
178 -
 179
179 -
 180
180 -
 181
181 -
 182
182 -
 183
183 -
 184
184 -
 185
185 -
 186
186 -
 187
187 -
 188
188 -
 189
189 -
 190
190 -
 191
191 -
 192
192 -
 193
193 -
 194
194 -
 195
195 -
 196
196 -
 197
197 -
 198
198 -
199
-
200
-
201
-
202
-
203
-
204
-
205
-
206
-
207
-
208
-
209
-
210
-
211
-
212
-
213
-
214
-
215
-
216
-
217
-
218
-
219
-
220
-
221
-
222
-
223
-
224
-
225
-
226
-
227
-
228
-
229
-
230
-
231
-
232
-
233
-
234
-
235
-
236
-
237
-
238
-
239
-
240
-
241
-
242
-
243
-
244
-
245
-
246
-
247
-
248
-
249
-
250
-
251
-
252
-
253
-
254
-
255
-
256
-
257
-
258
-
259
-
260
-
261
-
262
-
263
-
264
-
265
-
266
 |
 |

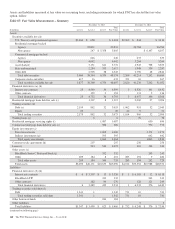
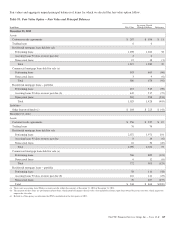
The following table provides additional information regarding the fair value and classification within the fair value hierarchy of
financial instruments.
Table 94: Additional Fair Value Information Related to Financial Instruments
Carrying
Amount
Fair Value
In millions Total Level 1 Level 2 Level 3
December 31, 2013
Assets
Cash and due from banks $ 4,043 $ 4,043 $ 4,043
Short-term assets 15,113 15,113 $ 15,113
Trading securities 3,073 3,073 2,179 862 $ 32
Investment securities 60,294 60,372 4,120 49,865 6,387
Trading loans 66 6
Loans held for sale 2,255 2,256 1,307 949
Net loans (excludes leases) 184,305 185,887 513 185,374
Other assets 4,162 4,162 209 1,949 2,004
Mortgage servicing rights 1,636 1,639 1,639
Financial derivatives
Designated as hedging instruments under GAAP 1,189 1,189 1,189
Not designated as hedging instruments under GAAP 3,604 3,604 25 3,543 36
Total Assets $279,680 $281,344 $10,576 $ 74,347 $196,421
Liabilities
Demand, savings and money market deposits $197,465 $197,465 $197,465
Time deposits 23,466 23,487 23,487
Borrowed funds 46,427 47,258 $ 1,341 44,431 $ 1,486
Financial derivatives
Designated as hedging instruments under GAAP 364 364 364
Not designated as hedging instruments under GAAP 3,570 3,570 6 3,125 439
Unfunded loan commitments and letters of credit 224 224 224
Total Liabilities $271,516 $272,368 $ 1,347 $268,872 $ 2,149
December 31, 2012
Assets
Cash and due from banks $ 5,220 $ 5,220 $ 5,220
Short-term assets 6,495 6,495 $ 6,495
Trading securities 2,096 2,096 1,104 960 $ 32
Investment securities 61,406 61,912 2,897 51,789 7,226
Trading loans 76 76 76
Loans held for sale 3,693 3,697 2,069 1,628
Net loans (excludes leases) 174,575 177,215 110 177,105
Other assets 4,265 4,265 283 1,917 2,065
Mortgage servicing rights 1,070 1,077 1,077
Financial derivatives
Designated as hedging instruments under GAAP 1,872 1,872 1,872
Not designated as hedging instruments under GAAP 6,696 6,696 5 6,585 106
Total Assets $267,464 $270,621 $ 9,509 $ 71,873 $189,239
Liabilities
Demand, savings and money market deposits $187,051 $187,051 $187,051
Time deposits 26,091 26,347 26,347
Borrowed funds 40,907 42,329 $ 731 40,505 $ 1,093
Financial derivatives
Designated as hedging instruments under GAAP 152 152 152
Not designated as hedging instruments under GAAP 6,458 6,458 1 6,081 376
Unfunded loan commitments and letters of credit 231 231 231
Total Liabilities $260,890 $262,568 $ 732 $260,136 $ 1,700
170 The PNC Financial Services Group, Inc. – Form 10-K