PNC Bank 2013 Annual Report Download - page 59
Download and view the complete annual report
Please find page 59 of the 2013 PNC Bank annual report below. You can navigate through the pages in the report by either clicking on the pages listed below, or by using the keyword search tool below to find specific information within the annual report.-
 1
1 -
2
-
3
-
4
-
5
-
6
-
7
-
8
-
9
-
10
-
11
-
12
-
13
-
14
-
15
-
16
-
17
-
18
-
19
-
20
-
21
-
22
-
23
-
24
-
25
-
26
-
27
-
28
-
29
-
30
-
31
-
32
-
33
-
34
-
35
-
36
-
37
-
38
-
39
-
40
-
41
-
42
-
43
-
44
-
45
-
46
-
47
-
48
-
 49
49 -
 50
50 -
 51
51 -
 52
52 -
 53
53 -
 54
54 -
 55
55 -
 56
56 -
 57
57 -
 58
58 -
 59
59 -
 60
60 -
 61
61 -
 62
62 -
 63
63 -
 64
64 -
 65
65 -
 66
66 -
 67
67 -
 68
68 -
 69
69 -
70
-
71
-
72
-
73
-
74
-
75
-
76
-
77
-
78
-
79
-
80
-
81
-
82
-
83
-
84
-
85
-
86
-
87
-
88
-
89
-
90
-
91
-
92
-
93
-
94
-
95
-
96
-
97
-
98
-
99
-
100
-
101
-
102
-
103
-
104
-
105
-
106
-
107
-
108
-
109
-
110
-
111
-
112
-
113
-
114
-
115
-
116
-
117
-
118
-
119
-
120
-
121
-
122
-
123
-
124
-
125
-
126
-
127
-
128
-
129
-
130
-
131
-
132
-
133
-
134
-
135
-
136
-
137
-
138
-
139
-
140
-
141
-
142
-
143
-
144
-
145
-
146
-
147
-
148
-
149
-
150
-
151
-
152
-
153
-
154
-
155
-
156
-
157
-
158
-
159
-
160
-
161
-
162
-
163
-
164
-
165
-
166
-
167
-
168
-
169
-
170
-
171
-
172
-
173
-
174
-
175
-
176
-
177
-
178
-
179
-
180
-
181
-
182
-
183
-
184
-
185
-
186
-
187
-
188
-
189
-
190
-
191
-
192
-
193
-
194
-
195
-
196
-
197
-
198
-
199
-
200
-
201
-
202
-
203
-
204
-
205
-
206
-
207
-
208
-
209
-
210
-
211
-
212
-
213
-
214
-
215
-
216
-
217
-
218
-
219
-
220
-
221
-
222
-
223
-
224
-
225
-
226
-
227
-
228
-
229
-
230
-
231
-
232
-
233
-
234
-
235
-
236
-
237
-
238
-
239
-
240
-
241
-
242
-
243
-
244
-
245
-
246
-
247
-
248
-
249
-
250
-
251
-
252
-
253
-
254
-
255
-
256
-
257
-
258
-
259
-
260
-
261
-
262
-
263
-
264
-
265
-
266
 |
 |

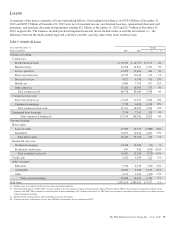
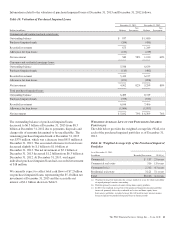
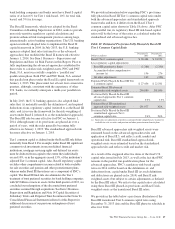
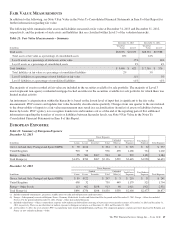
Information related to the valuation of purchased impaired loans at December 31, 2013 and December 31, 2012 follows.
Table 10: Valuation of Purchased Impaired Loans
December 31, 2013 December 31, 2012
Dollars in millions Balance
Net
Investment Balance
Net
Investment
Commercial and commercial real estate loans:
Outstanding balance $ 937 $ 1,680
Purchased impaired mark (264) (431)
Recorded investment 673 1,249
Allowance for loan losses (133) (239)
Net investment 540 58% 1,010 60%
Consumer and residential mortgage loans:
Outstanding balance 5,548 6,639
Purchased impaired mark (115) (482)
Recorded investment 5,433 6,157
Allowance for loan losses (871) (858)
Net investment 4,562 82% 5,299 80%
Total purchased impaired loans:
Outstanding balance 6,485 8,319
Purchased impaired mark (379) (913)
Recorded investment 6,106 7,406
Allowance for loan losses (1,004) (1,097)
Net investment $ 5,102 79% $ 6,309 76%
The outstanding balance of purchased impaired loans
decreased to $6.5 billion at December 31, 2013 from $8.3
billion at December 31, 2012 due to payments, disposals and
charge-offs of amounts determined to be uncollectible. The
remaining purchased impaired mark at December 31, 2013
was $379 million, which was a decrease from $913 million at
December 31, 2012. The associated allowance for loan losses
decreased slightly by $.1 billion to $1.0 billion at
December 31, 2013. The net investment of $5.1 billion at
December 31, 2013 decreased $1.2 billion from $6.3 billion at
December 31, 2012. At December 31, 2013, our largest
individual purchased impaired loan had a recorded investment
of $18 million.
We currently expect to collect total cash flows of $7.2 billion
on purchased impaired loans, representing the $5.1 billion net
investment at December 31, 2013 and the accretable net
interest of $2.1 billion shown in Table 9.
W
EIGHTED
A
VERAGE
L
IFEOFTHE
P
URCHASED
I
MPAIRED
P
ORTFOLIOS
The table below provides the weighted average life (WAL) for
each of the purchased impaired portfolios as of December 31,
2013.
Table 11: Weighted Average Life of the Purchased Impaired
Portfolios
As of December 31, 2013
In millions Recorded Investment WAL (a)
Commercial $ 157 2.0 years
Commercial real estate 516 1.8 years
Consumer (b) (c) 2,312 4.3 years
Residential real estate 3,121 5.1 years
Total $6,106 4.4 years
(a) Weighted average life represents the average number of years for which each dollar
of unpaid principal remains outstanding.
(b) Portfolio primarily consists of nonrevolving home equity products.
(c) In 2013, the weighted average life of the purchased impaired consumer portfolio
increased, primarily driven by residential real estate and home equity loans.
Increasing a portfolio’s weighted average life will result in more interest income
being recognized on purchased impaired loans in future periods.
The PNC Financial Services Group, Inc. – Form 10-K 41