PNC Bank 2013 Annual Report Download - page 56
Download and view the complete annual report
Please find page 56 of the 2013 PNC Bank annual report below. You can navigate through the pages in the report by either clicking on the pages listed below, or by using the keyword search tool below to find specific information within the annual report.-
 1
1 -
2
-
3
-
4
-
5
-
6
-
7
-
8
-
9
-
10
-
11
-
12
-
13
-
14
-
15
-
16
-
17
-
18
-
19
-
20
-
21
-
22
-
23
-
24
-
25
-
26
-
27
-
28
-
29
-
30
-
31
-
32
-
33
-
34
-
35
-
36
-
37
-
38
-
39
-
40
-
41
-
42
-
43
-
44
-
45
-
 46
46 -
 47
47 -
 48
48 -
 49
49 -
 50
50 -
 51
51 -
 52
52 -
 53
53 -
 54
54 -
 55
55 -
 56
56 -
 57
57 -
 58
58 -
 59
59 -
 60
60 -
 61
61 -
 62
62 -
 63
63 -
 64
64 -
 65
65 -
 66
66 -
67
-
68
-
69
-
70
-
71
-
72
-
73
-
74
-
75
-
76
-
77
-
78
-
79
-
80
-
81
-
82
-
83
-
84
-
85
-
86
-
87
-
88
-
89
-
90
-
91
-
92
-
93
-
94
-
95
-
96
-
97
-
98
-
99
-
100
-
101
-
102
-
103
-
104
-
105
-
106
-
107
-
108
-
109
-
110
-
111
-
112
-
113
-
114
-
115
-
116
-
117
-
118
-
119
-
120
-
121
-
122
-
123
-
124
-
125
-
126
-
127
-
128
-
129
-
130
-
131
-
132
-
133
-
134
-
135
-
136
-
137
-
138
-
139
-
140
-
141
-
142
-
143
-
144
-
145
-
146
-
147
-
148
-
149
-
150
-
151
-
152
-
153
-
154
-
155
-
156
-
157
-
158
-
159
-
160
-
161
-
162
-
163
-
164
-
165
-
166
-
167
-
168
-
169
-
170
-
171
-
172
-
173
-
174
-
175
-
176
-
177
-
178
-
179
-
180
-
181
-
182
-
183
-
184
-
185
-
186
-
187
-
188
-
189
-
190
-
191
-
192
-
193
-
194
-
195
-
196
-
197
-
198
-
199
-
200
-
201
-
202
-
203
-
204
-
205
-
206
-
207
-
208
-
209
-
210
-
211
-
212
-
213
-
214
-
215
-
216
-
217
-
218
-
219
-
220
-
221
-
222
-
223
-
224
-
225
-
226
-
227
-
228
-
229
-
230
-
231
-
232
-
233
-
234
-
235
-
236
-
237
-
238
-
239
-
240
-
241
-
242
-
243
-
244
-
245
-
246
-
247
-
248
-
249
-
250
-
251
-
252
-
253
-
254
-
255
-
256
-
257
-
258
-
259
-
260
-
261
-
262
-
263
-
264
-
265
-
266
 |
 |

C
ONSOLIDATED
B
ALANCE
S
HEET
R
EVIEW
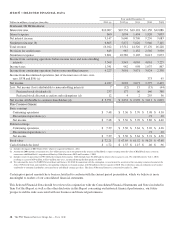
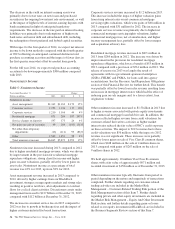
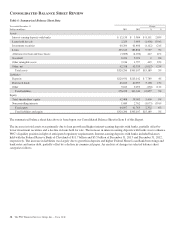
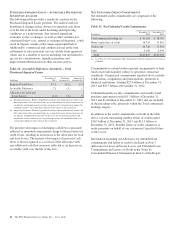
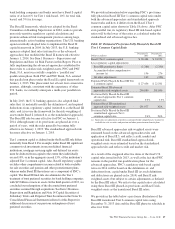
Table 6: Summarized Balance Sheet Data
Year ended December 31 Change
Dollars in millions 2013 2012 $ %
Assets
Interest-earning deposits with banks $ 12,135 $ 3,984 $ 8,151 205%
Loans held for sale 2,255 3,693 (1,438) (39)%
Investment securities 60,294 61,406 (1,112) (2)%
Loans 195,613 185,856 9,757 5%
Allowance for loan and lease losses (3,609) (4,036) 427 11%
Goodwill 9,074 9,072 2 0%
Other intangible assets 2,216 1,797 419 23%
Other, net 42,318 43,335 (1,017) (2)%
Total assets $320,296 $305,107 $15,189 5%
Liabilities
Deposits $220,931 $213,142 $ 7,789 4%
Borrowed funds 46,105 40,907 5,198 13%
Other 9,163 9,293 (130) (1)%
Total liabilities 276,199 263,342 12,857 5%
Equity
Total shareholders’ equity 42,408 39,003 3,405 9%
Noncontrolling interests 1,689 2,762 (1,073) (39)%
Total equity 44,097 41,765 2,332 6%
Total liabilities and equity $320,296 $305,107 $15,189 5%
The summarized balance sheet data above is based upon our Consolidated Balance Sheet in Item 8 of this Report.
The increase in total assets was primarily due to loan growth and higher interest-earning deposits with banks, partially offset by
lower investment securities and a decline in loans held for sale. The increase in interest-earning deposits with banks was to enhance
PNC’s liquidity position in light of anticipated regulatory requirements. Interest-earning deposits with banks included balances
held with the Federal Reserve Bank of Cleveland of $11.7 billion and $3.5 billion at December 31, 2013 and December 31, 2012,
respectively. The increase in liabilities was largely due to growth in deposits and higher Federal Home Loan Bank borrowings and
bank notes and senior debt, partially offset by a decline in commercial paper. An analysis of changes in selected balance sheet
categories follows.
38 The PNC Financial Services Group, Inc. – Form 10-K