PNC Bank 2013 Annual Report Download - page 82
Download and view the complete annual report
Please find page 82 of the 2013 PNC Bank annual report below. You can navigate through the pages in the report by either clicking on the pages listed below, or by using the keyword search tool below to find specific information within the annual report.-
 1
1 -
2
-
3
-
4
-
5
-
6
-
7
-
8
-
9
-
10
-
11
-
12
-
13
-
14
-
15
-
16
-
17
-
18
-
19
-
20
-
21
-
22
-
23
-
24
-
25
-
26
-
27
-
28
-
29
-
30
-
31
-
32
-
33
-
34
-
35
-
36
-
37
-
38
-
39
-
40
-
41
-
42
-
43
-
44
-
45
-
46
-
47
-
48
-
49
-
50
-
51
-
52
-
53
-
54
-
55
-
56
-
57
-
58
-
59
-
60
-
61
-
62
-
63
-
64
-
65
-
66
-
67
-
68
-
69
-
70
-
71
-
 72
72 -
 73
73 -
 74
74 -
 75
75 -
 76
76 -
 77
77 -
 78
78 -
 79
79 -
 80
80 -
 81
81 -
 82
82 -
 83
83 -
 84
84 -
 85
85 -
 86
86 -
 87
87 -
 88
88 -
 89
89 -
 90
90 -
 91
91 -
 92
92 -
93
-
94
-
95
-
96
-
97
-
98
-
99
-
100
-
101
-
102
-
103
-
104
-
105
-
106
-
107
-
108
-
109
-
110
-
111
-
112
-
113
-
114
-
115
-
116
-
117
-
118
-
119
-
120
-
121
-
122
-
123
-
124
-
125
-
126
-
127
-
128
-
129
-
130
-
131
-
132
-
133
-
134
-
135
-
136
-
137
-
138
-
139
-
140
-
141
-
142
-
143
-
144
-
145
-
146
-
147
-
148
-
149
-
150
-
151
-
152
-
153
-
154
-
155
-
156
-
157
-
158
-
159
-
160
-
161
-
162
-
163
-
164
-
165
-
166
-
167
-
168
-
169
-
170
-
171
-
172
-
173
-
174
-
175
-
176
-
177
-
178
-
179
-
180
-
181
-
182
-
183
-
184
-
185
-
186
-
187
-
188
-
189
-
190
-
191
-
192
-
193
-
194
-
195
-
196
-
197
-
198
-
199
-
200
-
201
-
202
-
203
-
204
-
205
-
206
-
207
-
208
-
209
-
210
-
211
-
212
-
213
-
214
-
215
-
216
-
217
-
218
-
219
-
220
-
221
-
222
-
223
-
224
-
225
-
226
-
227
-
228
-
229
-
230
-
231
-
232
-
233
-
234
-
235
-
236
-
237
-
238
-
239
-
240
-
241
-
242
-
243
-
244
-
245
-
246
-
247
-
248
-
249
-
250
-
251
-
252
-
253
-
254
-
255
-
256
-
257
-
258
-
259
-
260
-
261
-
262
-
263
-
264
-
265
-
266
 |
 |
R
EVENUE
R
ECOGNITION
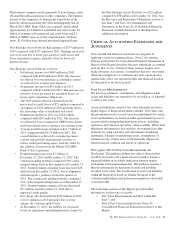
We earn net interest and noninterest income from various
sources, including:
• Lending,
• Securities portfolio,
• Asset management,
• Customer deposits,
• Loan sales and servicing,
• Brokerage services,
• Sale of loans and securities,
• Certain private equity activities, and
• Securities, derivatives and foreign exchange
activities.
We also earn fees and commissions from issuing loan
commitments, standby letters of credit and financial guarantees,
selling various insurance products, providing treasury
management services, providing merger and acquisition
advisory and related services, and participating in certain capital
markets transactions. Revenue earned on interest-earning assets,
including the accretion of discounts recognized on acquired or
purchased loans recorded at fair value, is recognized based on
the constant effective yield of the financial instrument or based
on other applicable accounting guidance.
The timing and amount of revenue that we recognize in any
period is dependent on estimates, judgments, assumptions, and
interpretation of contractual terms. Changes in these factors can
have a significant impact on revenue recognized in any period
due to changes in products, market conditions or industry norms.
R
ESIDENTIAL AND
C
OMMERCIAL
M
ORTGAGE
S
ERVICING
R
IGHTS
We elect to measure our residential mortgage servicing rights
(MSRs) at fair value. This election was made to be consistent
with our risk management strategy to hedge changes in the
fair value of these assets as described below. The fair value of
residential MSRs is estimated by using a cash flow valuation
model which calculates the present value of estimated future
net servicing cash flows, taking into consideration actual and
expected mortgage loan prepayment rates, discount rates,
servicing costs, and other economic factors which are
determined based on current market conditions.
Commercial MSRs are purchased or originated when loans are
sold with servicing retained. Commercial MSRs do not trade
in an active market with readily observable prices so the
precise terms and conditions of sales are not available.
Commercial MSRs are initially recorded at fair value and are
subsequently accounted for at the lower of amortized cost or
fair value. Commercial MSRs are periodically evaluated for
impairment. For purposes of impairment, the commercial
MSRs are stratified based on asset type, which characterizes
the predominant risk of the underlying financial asset. The fair
value of commercial MSRs is estimated by using a discounted
cash flow model incorporating inputs for assumptions as to
constant prepayment rates, discount rates and other factors
determined based on current market conditions and
expectations. As of January 1, 2014, PNC made an irrevocable
election to subsequently measure all classes of commercial
MSRs at fair value in order to eliminate any potential
measurement mismatch between our economic hedges and the
commercial MSRs. The impact was not material. We will
recognize gain/(loss) on changes in the fair value of
commercial MSRs as a result of that election.
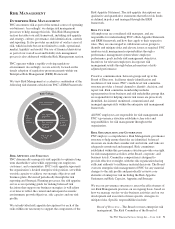
PNC employs risk management strategies designed to protect
the value of MSRs from changes in interest rates and related
market factors. Residential MSRs values are economically
hedged with securities and derivatives, including interest-rate
swaps, options, and forward mortgage-backed and futures
contracts. As interest rates change, these financial instruments
are expected to have changes in fair value negatively
correlated to the change in fair value of the hedged residential
MSRs portfolio. The hedge relationships are actively managed
in response to changing market conditions over the life of the
residential MSRs assets. Commercial MSRs are economically
hedged at a macro level or with specific derivatives to protect
against a significant decline in interest rates. Selecting
appropriate financial instruments to economically hedge
residential or commercial MSRs requires significant
management judgment to assess how mortgage rates and
prepayment speeds could affect the future values of MSRs.
Hedging results can frequently be less predictable in the short
term, but over longer periods of time are expected to protect
the economic value of the MSRs.
The following sections of this Report provide further
information on residential and commercial MSRs:
• Note 9 Fair Value included in the Notes To
Consolidated Financial Statements in Item 8 of this
Report.
• Note 10 Goodwill and Other Intangible Assets
included in the Notes To Consolidated Financial
Statements in Item 8 of this Report.
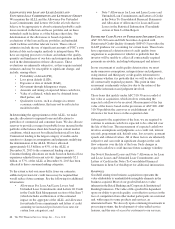
I
NCOME
T
AXES
In the normal course of business, we and our subsidiaries enter
into transactions for which the tax treatment is unclear or
subject to varying interpretations. In addition, filing
requirements, methods of filing and the calculation of taxable
income in various state and local jurisdictions are subject to
differing interpretations.
We evaluate and assess the relative risks and merits of the tax
treatment of transactions, filing positions, filing methods and
taxable income calculations after considering statutes,
regulations, judicial precedent, and other information, and
maintain tax accruals consistent with our evaluation of these
relative risks and merits. The result of our evaluation and
assessment is by its nature an estimate. We and our subsidiaries
are routinely subject to audit and challenges from taxing
authorities. In the event we resolve a challenge for an amount
different than amounts previously accrued, we will account for
the difference in the period in which we resolve the matter.
64 The PNC Financial Services Group, Inc. – Form 10-K