PNC Bank 2013 Annual Report Download - page 167
Download and view the complete annual report
Please find page 167 of the 2013 PNC Bank annual report below. You can navigate through the pages in the report by either clicking on the pages listed below, or by using the keyword search tool below to find specific information within the annual report.-
 1
1 -
2
-
3
-
4
-
5
-
6
-
7
-
8
-
9
-
10
-
11
-
12
-
13
-
14
-
15
-
16
-
17
-
18
-
19
-
20
-
21
-
22
-
23
-
24
-
25
-
26
-
27
-
28
-
29
-
30
-
31
-
32
-
33
-
34
-
35
-
36
-
37
-
38
-
39
-
40
-
41
-
42
-
43
-
44
-
45
-
46
-
47
-
48
-
49
-
50
-
51
-
52
-
53
-
54
-
55
-
56
-
57
-
58
-
59
-
60
-
61
-
62
-
63
-
64
-
65
-
66
-
67
-
68
-
69
-
70
-
71
-
72
-
73
-
74
-
75
-
76
-
77
-
78
-
79
-
80
-
81
-
82
-
83
-
84
-
85
-
86
-
87
-
88
-
89
-
90
-
91
-
92
-
93
-
94
-
95
-
96
-
97
-
98
-
99
-
100
-
101
-
102
-
103
-
104
-
105
-
106
-
107
-
108
-
109
-
110
-
111
-
112
-
113
-
114
-
115
-
116
-
117
-
118
-
119
-
120
-
121
-
122
-
123
-
124
-
125
-
126
-
127
-
128
-
129
-
130
-
131
-
132
-
133
-
134
-
135
-
136
-
137
-
138
-
139
-
140
-
141
-
142
-
143
-
144
-
145
-
146
-
147
-
148
-
149
-
150
-
151
-
152
-
153
-
154
-
155
-
156
-
 157
157 -
 158
158 -
 159
159 -
 160
160 -
 161
161 -
 162
162 -
 163
163 -
 164
164 -
 165
165 -
 166
166 -
 167
167 -
 168
168 -
 169
169 -
 170
170 -
 171
171 -
 172
172 -
 173
173 -
 174
174 -
 175
175 -
 176
176 -
 177
177 -
178
-
179
-
180
-
181
-
182
-
183
-
184
-
185
-
186
-
187
-
188
-
189
-
190
-
191
-
192
-
193
-
194
-
195
-
196
-
197
-
198
-
199
-
200
-
201
-
202
-
203
-
204
-
205
-
206
-
207
-
208
-
209
-
210
-
211
-
212
-
213
-
214
-
215
-
216
-
217
-
218
-
219
-
220
-
221
-
222
-
223
-
224
-
225
-
226
-
227
-
228
-
229
-
230
-
231
-
232
-
233
-
234
-
235
-
236
-
237
-
238
-
239
-
240
-
241
-
242
-
243
-
244
-
245
-
246
-
247
-
248
-
249
-
250
-
251
-
252
-
253
-
254
-
255
-
256
-
257
-
258
-
259
-
260
-
261
-
262
-
263
-
264
-
265
-
266
 |
 |

N
OTE
8I
NVESTMENT
S
ECURITIES
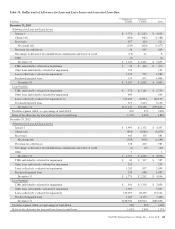
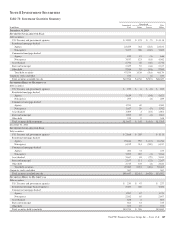
Table 78: Investment Securities Summary
In millions
Amortized
Cost
Unrealized Fair
ValueGains Losses
December 31, 2013
S
ECURITIES
A
VAILABLE FOR
S
ALE
Debt securities
U.S. Treasury and government agencies $ 3,990 $ 135 $ (7) $ 4,118
Residential mortgage-backed
Agency 22,669 384 (222) 22,831
Non-agency 5,457 308 (160) 5,605
Commercial mortgage-backed
Agency 632 15 (1) 646
Non-agency 3,937 123 (18) 4,042
Asset-backed 5,754 66 (48) 5,772
State and municipal 2,609 52 (44) 2,617
Other debt 2,506 55 (18) 2,543
Total debt securities 47,554 1,138 (518) 48,174
Corporate stocks and other 434 (1) 433
Total securities available for sale $47,988 $1,138 $(519) $48,607
S
ECURITIES
H
ELD TO
M
ATURITY
(a)
Debt securities
U.S. Treasury and government agencies $ 239 $ 8 $ (4) $ 243
Residential mortgage-backed
Agency 5,814 71 (64) 5,821
Non-agency 293 (4) 289
Commercial mortgage-backed
Agency 1,251 49 1,300
Non-agency 1,687 20 (5) 1,702
Asset-backed 1,009 2 (10) 1,001
State and municipal 1,055 10 (4) 1,061
Other debt 339 9 348
Total securities held to maturity $11,687 $ 169 $ (91) $11,765
December 31, 2012
S
ECURITIES
A
VAILABLE FOR
S
ALE
Debt securities
U.S. Treasury and government agencies $ 2,868 $ 245 $ 3,113
Residential mortgage-backed
Agency 25,844 952 $ (12) 26,784
Non-agency 6,102 314 (309) 6,107
Commercial mortgage-backed
Agency 602 31 633
Non-agency 3,055 210 (1) 3,264
Asset-backed 5,667 65 (79) 5,653
State and municipal 2,197 111 (21) 2,287
Other debt 2,745 103 (4) 2,844
Total debt securities 49,080 2,031 (426) 50,685
Corporate stocks and other 367 367
Total securities available for sale $49,447 $2,031 $(426) $51,052
S
ECURITIES
H
ELD TO
M
ATURITY
(a)
Debt securities
U.S. Treasury and government agencies $ 230 $ 47 $ 277
Residential mortgage-backed (agency) 4,380 202 4,582
Commercial mortgage-backed
Agency 1,287 87 1,374
Non-agency 2,582 85 2,667
Asset-backed 858 5 863
State and municipal 664 61 725
Other debt 353 19 372
Total securities held to maturity $10,354 $ 506 $10,860
The PNC Financial Services Group, Inc. – Form 10-K 149