PNC Bank 2013 Annual Report Download - page 185
Download and view the complete annual report
Please find page 185 of the 2013 PNC Bank annual report below. You can navigate through the pages in the report by either clicking on the pages listed below, or by using the keyword search tool below to find specific information within the annual report.-
 1
1 -
2
-
3
-
4
-
5
-
6
-
7
-
8
-
9
-
10
-
11
-
12
-
13
-
14
-
15
-
16
-
17
-
18
-
19
-
20
-
21
-
22
-
23
-
24
-
25
-
26
-
27
-
28
-
29
-
30
-
31
-
32
-
33
-
34
-
35
-
36
-
37
-
38
-
39
-
40
-
41
-
42
-
43
-
44
-
45
-
46
-
47
-
48
-
49
-
50
-
51
-
52
-
53
-
54
-
55
-
56
-
57
-
58
-
59
-
60
-
61
-
62
-
63
-
64
-
65
-
66
-
67
-
68
-
69
-
70
-
71
-
72
-
73
-
74
-
75
-
76
-
77
-
78
-
79
-
80
-
81
-
82
-
83
-
84
-
85
-
86
-
87
-
88
-
89
-
90
-
91
-
92
-
93
-
94
-
95
-
96
-
97
-
98
-
99
-
100
-
101
-
102
-
103
-
104
-
105
-
106
-
107
-
108
-
109
-
110
-
111
-
112
-
113
-
114
-
115
-
116
-
117
-
118
-
119
-
120
-
121
-
122
-
123
-
124
-
125
-
126
-
127
-
128
-
129
-
130
-
131
-
132
-
133
-
134
-
135
-
136
-
137
-
138
-
139
-
140
-
141
-
142
-
143
-
144
-
145
-
146
-
147
-
148
-
149
-
150
-
151
-
152
-
153
-
154
-
155
-
156
-
157
-
158
-
159
-
160
-
161
-
162
-
163
-
164
-
165
-
166
-
167
-
168
-
169
-
170
-
171
-
172
-
173
-
174
-
 175
175 -
 176
176 -
 177
177 -
 178
178 -
 179
179 -
 180
180 -
 181
181 -
 182
182 -
 183
183 -
 184
184 -
 185
185 -
 186
186 -
 187
187 -
 188
188 -
 189
189 -
 190
190 -
 191
191 -
 192
192 -
 193
193 -
 194
194 -
 195
195 -
196
-
197
-
198
-
199
-
200
-
201
-
202
-
203
-
204
-
205
-
206
-
207
-
208
-
209
-
210
-
211
-
212
-
213
-
214
-
215
-
216
-
217
-
218
-
219
-
220
-
221
-
222
-
223
-
224
-
225
-
226
-
227
-
228
-
229
-
230
-
231
-
232
-
233
-
234
-
235
-
236
-
237
-
238
-
239
-
240
-
241
-
242
-
243
-
244
-
245
-
246
-
247
-
248
-
249
-
250
-
251
-
252
-
253
-
254
-
255
-
256
-
257
-
258
-
259
-
260
-
261
-
262
-
263
-
264
-
265
-
266
 |
 |

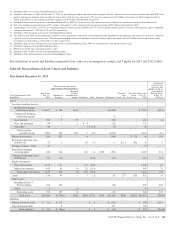
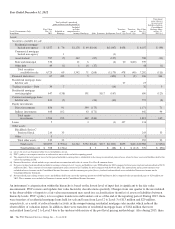
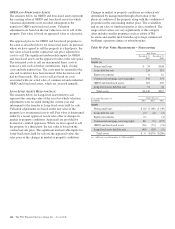
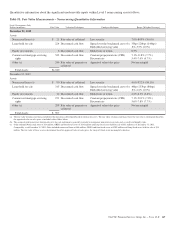
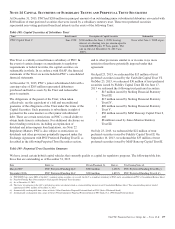
Quantitative information about the significant unobservable inputs within Level 3 nonrecurring assets follows.
Table 91: Fair Value Measurements – Nonrecurring Quantitative Information
Level 3 Instruments Only
Dollars in millions Fair Value Valuation Techniques Unobservable Inputs Range (Weighted Average)
December 31, 2013
Assets
Nonaccrual loans (a) $ 21 Fair value of collateral Loss severity 7.0%-84.9% (36.6%)
Loans held for sale 224 Discounted cash flow Spread over the benchmark curve (b)
Embedded servicing value
35bps-220bps (144bps)
.8%-3.5% (2.0%)
Equity investments 6 Discounted cash flow Market rate of return 6.5%
Commercial mortgage servicing
rights
543 Discounted cash flow Constant prepayment rate (CPR)
Discount rate
7.1%-11.8% (7.7%)
5.4%-7.6% (6.7%)
Other (c) 246 Fair value of property or
collateral
Appraised value/sales price Not meaningful
Total Assets $1,040
December 31, 2012
Assets
Nonaccrual loans (a) $ 90 Fair value of collateral Loss severity 4.6%-97.2% (58.1%)
Loans held for sale 315 Discounted cash flow Spread over the benchmark curve (b)
Embedded servicing value
40bps-233bps (86bps)
.8%-2.6% (2.0%)
Equity investments 12 Discounted cash flow Market rate of return 4.6%-6.5% (5.4%)
Commercial mortgage servicing
rights
191 Discounted cash flow Constant prepayment rate (CPR)
Discount rate
7.1%-20.1% (7.8%)
5.6%-7.8% (7.7%)
Other (c) 299 Fair value of property or
collateral
Appraised value/sales price Not meaningful
Total Assets $ 907
(a) The fair value of nonaccrual loans included in this line item is determined based on internal loss rates. The fair value of nonaccrual loans where the fair value is determined based on
the appraised value or sales price is included within Other, below.
(b) The assumed yield spread over benchmark curve for each instrument is generally intended to incorporate non-interest-rate risks such as credit and liquidity risks.
(c) Other included Nonaccrual loans of $14 million, OREO and foreclosed assets of $181 million and Long-lived assets held for sale of $51 million as of December 31, 2013.
Comparably, as of December 31, 2012, Other included nonaccrual loans of $68 million, OREO and foreclosed assets of $207 million and Long-lived assets held for sale of $24
million. The fair value of these assets is determined based on appraised value or sales price, the range of which is not meaningful to disclose.
The PNC Financial Services Group, Inc. – Form 10-K 167