PNC Bank 2013 Annual Report Download - page 151
Download and view the complete annual report
Please find page 151 of the 2013 PNC Bank annual report below. You can navigate through the pages in the report by either clicking on the pages listed below, or by using the keyword search tool below to find specific information within the annual report.-
 1
1 -
2
-
3
-
4
-
5
-
6
-
7
-
8
-
9
-
10
-
11
-
12
-
13
-
14
-
15
-
16
-
17
-
18
-
19
-
20
-
21
-
22
-
23
-
24
-
25
-
26
-
27
-
28
-
29
-
30
-
31
-
32
-
33
-
34
-
35
-
36
-
37
-
38
-
39
-
40
-
41
-
42
-
43
-
44
-
45
-
46
-
47
-
48
-
49
-
50
-
51
-
52
-
53
-
54
-
55
-
56
-
57
-
58
-
59
-
60
-
61
-
62
-
63
-
64
-
65
-
66
-
67
-
68
-
69
-
70
-
71
-
72
-
73
-
74
-
75
-
76
-
77
-
78
-
79
-
80
-
81
-
82
-
83
-
84
-
85
-
86
-
87
-
88
-
89
-
90
-
91
-
92
-
93
-
94
-
95
-
96
-
97
-
98
-
99
-
100
-
101
-
102
-
103
-
104
-
105
-
106
-
107
-
108
-
109
-
110
-
111
-
112
-
113
-
114
-
115
-
116
-
117
-
118
-
119
-
120
-
121
-
122
-
123
-
124
-
125
-
126
-
127
-
128
-
129
-
130
-
131
-
132
-
133
-
134
-
135
-
136
-
137
-
138
-
139
-
140
-
 141
141 -
 142
142 -
 143
143 -
 144
144 -
 145
145 -
 146
146 -
 147
147 -
 148
148 -
 149
149 -
 150
150 -
 151
151 -
 152
152 -
 153
153 -
 154
154 -
 155
155 -
 156
156 -
 157
157 -
 158
158 -
 159
159 -
 160
160 -
 161
161 -
162
-
163
-
164
-
165
-
166
-
167
-
168
-
169
-
170
-
171
-
172
-
173
-
174
-
175
-
176
-
177
-
178
-
179
-
180
-
181
-
182
-
183
-
184
-
185
-
186
-
187
-
188
-
189
-
190
-
191
-
192
-
193
-
194
-
195
-
196
-
197
-
198
-
199
-
200
-
201
-
202
-
203
-
204
-
205
-
206
-
207
-
208
-
209
-
210
-
211
-
212
-
213
-
214
-
215
-
216
-
217
-
218
-
219
-
220
-
221
-
222
-
223
-
224
-
225
-
226
-
227
-
228
-
229
-
230
-
231
-
232
-
233
-
234
-
235
-
236
-
237
-
238
-
239
-
240
-
241
-
242
-
243
-
244
-
245
-
246
-
247
-
248
-
249
-
250
-
251
-
252
-
253
-
254
-
255
-
256
-
257
-
258
-
259
-
260
-
261
-
262
-
263
-
264
-
265
-
266
 |
 |

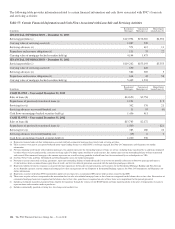
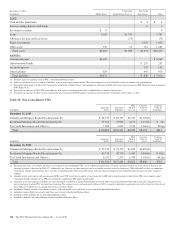
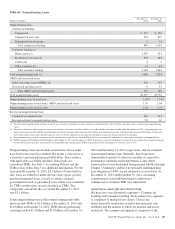
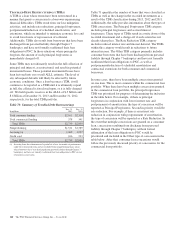
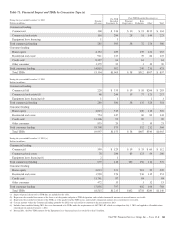
Table 64: Nonperforming Assets
Dollars in millions
December 31
2013
December 31
2012
Nonperforming loans
Commercial lending
Commercial $ 457 $ 590
Commercial real estate 518 807
Equipment lease financing 513
Total commercial lending 980 1,410
Consumer lending (a)
Home equity (b) 1,139 951
Residential real estate (b) 904 845
Credit card 45
Other consumer (b) 61 43
Total consumer lending 2,108 1,844
Total nonperforming loans (c) 3,088 3,254
OREO and foreclosed assets
Other real estate owned (OREO) (d) 360 507
Foreclosed and other assets 933
Total OREO and foreclosed assets 369 540
Total nonperforming assets $3,457 $3,794
Nonperforming loans to total loans 1.58% 1.75%
Nonperforming assets to total loans, OREO and foreclosed assets 1.76 2.04
Nonperforming assets to total assets 1.08 1.24
Interest on nonperforming loans
Computed on original terms 163 212
Recognized prior to nonperforming status 30 30
(a) Excludes most consumer loans and lines of credit, not secured by residential real estate, which are charged off after 120 to 180 days past due and are not placed on nonperforming
status.
(b) Pursuant to alignment with interagency supervisory guidance on practices for loans and lines of credit related to consumer lending in the first quarter of 2013, nonperforming home
equity loans increased $214 million, nonperforming residential mortgage loans increased $187 million and nonperforming other consumer loans increased $25 million. Charge-offs
were taken on these loans where the fair value less costs to sell the collateral was less than the recorded investment of the loan and were $134 million.
(c) Nonperforming loans exclude certain government insured or guaranteed loans, loans held for sale, loans accounted for under the fair value option and purchased impaired loans.
(d) OREO excludes $245 million and $380 million at December 31, 2013 and December 31, 2012, respectively, related to residential real estate that was acquired by us upon foreclosure
of serviced loans because they are insured by the Federal Housing Administration (FHA) or guaranteed by the Department of Veterans Affairs (VA).
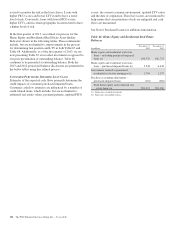
Nonperforming loans also include certain loans whose terms
have been restructured in a manner that grants a concession to
a borrower experiencing financial difficulties. In accordance
with applicable accounting guidance, these loans are
considered TDRs. See Note 1 Accounting Policies and the
TDR section of this Note 5 for additional information. For the
year ended December 31, 2013, $2.3 billion of loans held for
sale, loans accounted for under the fair value option, pooled
purchased impaired loans, as well as certain consumer
government insured or guaranteed loans which were evaluated
for TDR consideration, are not classified as TDRs. The
comparable amount for the year ended December 31, 2012
was $3.1 billion.
Total nonperforming loans in the nonperforming assets table
above include TDRs of $1.5 billion at December 31, 2013 and
$1.6 billion at December 31, 2012. TDRs that are performing
(accruing) totaled $1.1 billion and $1.0 billion at December 31,
2013 and December 31, 2012, respectively, and are excluded
from nonperforming loans. Generally, these loans have
demonstrated a period of at least six months of consecutive
performance under the restructured terms. Loans where
borrowers have been discharged from personal liability through
Chapter 7 bankruptcy and have not formally reaffirmed their
loan obligations to PNC are not returned to accrual status. At
December 31, 2013 and December 31, 2012, remaining
commitments to lend additional funds to debtors in a
commercial or consumer TDR were immaterial.
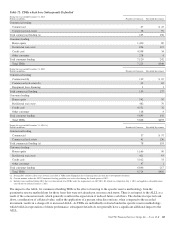
A
DDITIONAL
A
SSET
Q
UALITY
I
NDICATORS
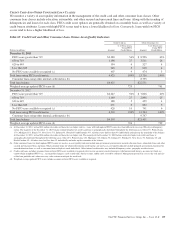
We have two overall portfolio segments – Commercial
Lending and Consumer Lending. Each of these two segments
is comprised of multiple loan classes. Classes are
characterized by similarities in initial measurement, risk
attributes and the manner in which we monitor and assess
credit risk. The commercial segment is comprised of the
The PNC Financial Services Group, Inc. – Form 10-K 133