PNC Bank 2013 Annual Report Download - page 219
Download and view the complete annual report
Please find page 219 of the 2013 PNC Bank annual report below. You can navigate through the pages in the report by either clicking on the pages listed below, or by using the keyword search tool below to find specific information within the annual report.-
 1
1 -
2
-
3
-
4
-
5
-
6
-
7
-
8
-
9
-
10
-
11
-
12
-
13
-
14
-
15
-
16
-
17
-
18
-
19
-
20
-
21
-
22
-
23
-
24
-
25
-
26
-
27
-
28
-
29
-
30
-
31
-
32
-
33
-
34
-
35
-
36
-
37
-
38
-
39
-
40
-
41
-
42
-
43
-
44
-
45
-
46
-
47
-
48
-
49
-
50
-
51
-
52
-
53
-
54
-
55
-
56
-
57
-
58
-
59
-
60
-
61
-
62
-
63
-
64
-
65
-
66
-
67
-
68
-
69
-
70
-
71
-
72
-
73
-
74
-
75
-
76
-
77
-
78
-
79
-
80
-
81
-
82
-
83
-
84
-
85
-
86
-
87
-
88
-
89
-
90
-
91
-
92
-
93
-
94
-
95
-
96
-
97
-
98
-
99
-
100
-
101
-
102
-
103
-
104
-
105
-
106
-
107
-
108
-
109
-
110
-
111
-
112
-
113
-
114
-
115
-
116
-
117
-
118
-
119
-
120
-
121
-
122
-
123
-
124
-
125
-
126
-
127
-
128
-
129
-
130
-
131
-
132
-
133
-
134
-
135
-
136
-
137
-
138
-
139
-
140
-
141
-
142
-
143
-
144
-
145
-
146
-
147
-
148
-
149
-
150
-
151
-
152
-
153
-
154
-
155
-
156
-
157
-
158
-
159
-
160
-
161
-
162
-
163
-
164
-
165
-
166
-
167
-
168
-
169
-
170
-
171
-
172
-
173
-
174
-
175
-
176
-
177
-
178
-
179
-
180
-
181
-
182
-
183
-
184
-
185
-
186
-
187
-
188
-
189
-
190
-
191
-
192
-
193
-
194
-
195
-
196
-
197
-
198
-
199
-
200
-
201
-
202
-
203
-
204
-
205
-
206
-
207
-
208
-
 209
209 -
 210
210 -
 211
211 -
 212
212 -
 213
213 -
 214
214 -
 215
215 -
 216
216 -
 217
217 -
 218
218 -
 219
219 -
 220
220 -
 221
221 -
 222
222 -
 223
223 -
 224
224 -
 225
225 -
 226
226 -
 227
227 -
 228
228 -
 229
229 -
230
-
231
-
232
-
233
-
234
-
235
-
236
-
237
-
238
-
239
-
240
-
241
-
242
-
243
-
244
-
245
-
246
-
247
-
248
-
249
-
250
-
251
-
252
-
253
-
254
-
255
-
256
-
257
-
258
-
259
-
260
-
261
-
262
-
263
-
264
-
265
-
266
 |
 |

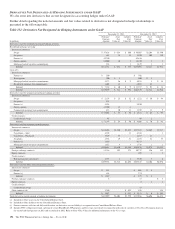
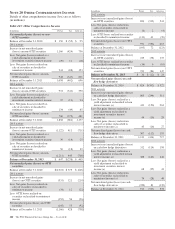
In millions Pretax Tax After-tax
2013 activity
Increase in net unrealized gains (losses)
on cash flow hedge derivatives (141) 52 (89)
Less: Net gains (losses) realized as a
yield adjustment reclassified to loan
interest income (a) 284 (103) 181
Less: Net gains (losses) realized as a
yield adjustment reclassified to
investment securities interest
income (a) 53 (19) 34
Less: Net gains (losses) realized on sales
of securities reclassified to noninterest
income (a) 49 (18) 31
Net unrealized gains (losses) on cash
flow hedge derivatives (527) 192 (335)
Balance at December 31, 2013 $ 384 $(141) $ 243
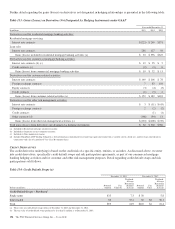
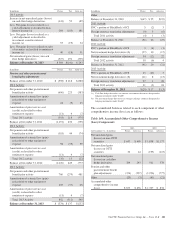
In millions Pretax Tax After-tax
Pension and other postretirement
benefit plan adjustments
Balance at December 31, 2010 $ (598) $ 218 $(380)
2011 Activity
Net pension and other postretirement
benefit plan activity (606) 223 (383)
Amortization of actuarial loss (gain)
reclassified to other noninterest
expense 24 (9) 15
Amortization of prior service cost
(credit) reclassified to other
noninterest expense (11) 4 (7)
Total 2011 activity (593) 218 (375)
Balance at December 31, 2011 (1,191) 436 (755)
2012 Activity
Net pension and other postretirement
benefit plan activity (118) 44 (74)
Amortization of actuarial loss (gain)
reclassified to other noninterest
expense 94 (35) 59
Amortization of prior service cost
(credit) reclassified to other
noninterest expense (11) 4 (7)
Total 2012 activity (35) 13 (22)
Balance at December 31, 2012 (1,226) 449 (777)
2013 Activity
Net pension and other postretirement
benefit plan activity 760 (279) 481
Amortization of actuarial loss (gain)
reclassified to other noninterest
expense 103 (37) 66
Amortization of prior service cost
(credit) reclassified to other
noninterest expense (11) 4 (7)
Total 2013 Activity 852 (312) 540
Balance at December 31, 2013 $ (374) $ 137 $(237)
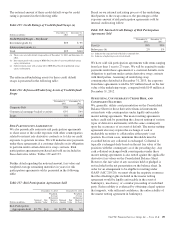
In millions Pretax Tax After-tax
Other
Balance at December 31, 2010 $(47) $ 25 $(22)
2011 Activity
PNC’s portion of BlackRock’s OCI 5 (2) 3
Foreign currency translation adjustments (9) 3 (6)
Total 2011 activity (4) 1 (3)
Balance at December 31, 2011 (51) 26 (25)
2012 Activity
PNC’s portion of BlackRock’s OCI 3 (4) (1)
Net investment hedge derivatives (b) (27) 10 (17)
Foreign currency translation adjustments 34 (12) 22
Total 2012 activity 10 (6) 4
Balance at December 31, 2012 (41) 20 (21)
2013 Activity
PNC’s portion of BlackRock’s OCI 15 (12) 3
Net investment hedge derivatives (b) (21) 8 (13)
Foreign currency translation adjustments 27 1 28
Total 2013 activity 21 (3) 18
Balance at December 31, 2013 $(20) $ 17 $ (3)
(a) Cash flow hedge derivatives are interest rate contract derivatives designated as
hedging instruments under GAAP.
(b) Net investment hedge derivatives are foreign exchange contracts designated as
hedging instruments under GAAP.
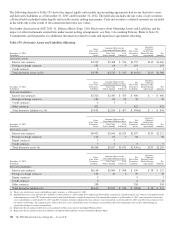
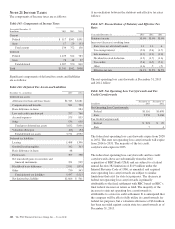
The accumulated balances related to each component of other
comprehensive income (loss) are as follows:
Table 144: Accumulated Other Comprehensive Income
(Loss) Components
2013 2012
At December 31 – In millions Pretax After-tax Pretax After-tax
Net unrealized gains
(losses) on non-OTTI
securities $ 647 $ 409 $ 1,858 $1,177
Net unrealized gains
(losses) on OTTI
securities 36 24 (195) (123)
Net unrealized gains
(losses) on cash flow
hedge derivatives 384 243 911 578
Pension and other
postretirement benefit
plan adjustments (374) (237) (1,226) (777)
Other (20) (3) (41) (21)
Accumulated other
comprehensive income
(loss) $ 673 $ 436 $ 1,307 $ 834
The PNC Financial Services Group, Inc. – Form 10-K 201