PNC Bank 2013 Annual Report Download - page 160
Download and view the complete annual report
Please find page 160 of the 2013 PNC Bank annual report below. You can navigate through the pages in the report by either clicking on the pages listed below, or by using the keyword search tool below to find specific information within the annual report.-
 1
1 -
2
-
3
-
4
-
5
-
6
-
7
-
8
-
9
-
10
-
11
-
12
-
13
-
14
-
15
-
16
-
17
-
18
-
19
-
20
-
21
-
22
-
23
-
24
-
25
-
26
-
27
-
28
-
29
-
30
-
31
-
32
-
33
-
34
-
35
-
36
-
37
-
38
-
39
-
40
-
41
-
42
-
43
-
44
-
45
-
46
-
47
-
48
-
49
-
50
-
51
-
52
-
53
-
54
-
55
-
56
-
57
-
58
-
59
-
60
-
61
-
62
-
63
-
64
-
65
-
66
-
67
-
68
-
69
-
70
-
71
-
72
-
73
-
74
-
75
-
76
-
77
-
78
-
79
-
80
-
81
-
82
-
83
-
84
-
85
-
86
-
87
-
88
-
89
-
90
-
91
-
92
-
93
-
94
-
95
-
96
-
97
-
98
-
99
-
100
-
101
-
102
-
103
-
104
-
105
-
106
-
107
-
108
-
109
-
110
-
111
-
112
-
113
-
114
-
115
-
116
-
117
-
118
-
119
-
120
-
121
-
122
-
123
-
124
-
125
-
126
-
127
-
128
-
129
-
130
-
131
-
132
-
133
-
134
-
135
-
136
-
137
-
138
-
139
-
140
-
141
-
142
-
143
-
144
-
145
-
146
-
147
-
148
-
149
-
 150
150 -
 151
151 -
 152
152 -
 153
153 -
 154
154 -
 155
155 -
 156
156 -
 157
157 -
 158
158 -
 159
159 -
 160
160 -
 161
161 -
 162
162 -
 163
163 -
 164
164 -
 165
165 -
 166
166 -
 167
167 -
 168
168 -
 169
169 -
 170
170 -
171
-
172
-
173
-
174
-
175
-
176
-
177
-
178
-
179
-
180
-
181
-
182
-
183
-
184
-
185
-
186
-
187
-
188
-
189
-
190
-
191
-
192
-
193
-
194
-
195
-
196
-
197
-
198
-
199
-
200
-
201
-
202
-
203
-
204
-
205
-
206
-
207
-
208
-
209
-
210
-
211
-
212
-
213
-
214
-
215
-
216
-
217
-
218
-
219
-
220
-
221
-
222
-
223
-
224
-
225
-
226
-
227
-
228
-
229
-
230
-
231
-
232
-
233
-
234
-
235
-
236
-
237
-
238
-
239
-
240
-
241
-
242
-
243
-
244
-
245
-
246
-
247
-
248
-
249
-
250
-
251
-
252
-
253
-
254
-
255
-
256
-
257
-
258
-
259
-
260
-
261
-
262
-
263
-
264
-
265
-
266
 |
 |
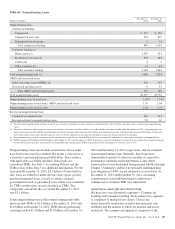
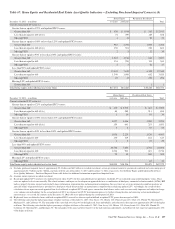
TDRs may result in charge-offs and interest income not being
recognized. At or around the time of modification, the amount
of principal balance of the TDRs charged off during the year
ended December 31, 2013 was not material. A financial effect
of rate reduction TDRs is that interest income is not
recognized. Interest income not recognized that otherwise
would have been earned in 2013 and 2012, related to both
commercial TDRs and consumer TDRs, was not material.
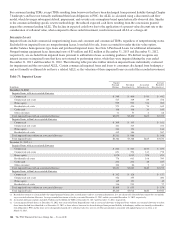
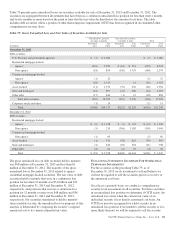
Pursuant to regulatory guidance issued in the third quarter of
2012, management compiled TDR information related to
changes in treatment of certain loans where a borrower has
been discharged from personal liability in bankruptcy and has
not formally reaffirmed its loan obligation to PNC. Because of
the timing of the compilation of the TDR information and the
fact that it covers several periods, $366 million of TDRs, net
of $128 million of charge-offs, related to this new regulatory
guidance, has not been reflected as part of the year ended
December 31, 2012 activity included in Table 71 and 72. This
information has been reflected in period end balance
disclosures for the year ended December 31, 2012.
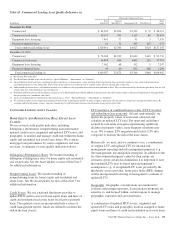
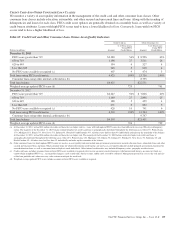
Allowance for loan losses has declined as a result of the
increase in identified loans where a borrower has been
discharged from personal liability in bankruptcy and has not
formally reaffirmed its loan obligation to PNC which have
been classified as TDRs. These loans have been charged off to
collateral value less costs to sell, and any associated allowance
at the time of charge-off was reduced to zero. Therefore, the
charge-off activity resulted in a reduction to the allowance in
prior periods, as well as the difference in pre-TDR recorded
investment to the post-TDR recorded investment reflected in
Table 71. As the change in treatment was adopted,
incremental provision for credit losses was recorded if the
related loan charge-off exceeded the associated allowance. In
future periods, subsequent declines in collateral value for
these loans will be charged off.
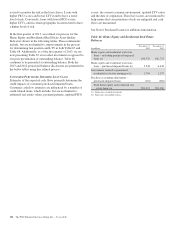
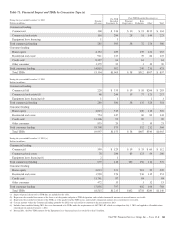
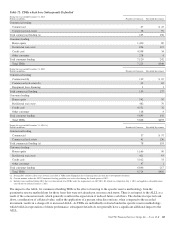
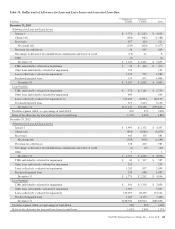
After a loan is determined to be a TDR, we continue to track
its performance under its most recent restructured terms. In
Table 72, we consider a TDR to have subsequently defaulted
when it becomes 60 days past due after the most recent date
the loan was restructured. The following table presents the
recorded investment of loans that were classified as TDRs or
were subsequently modified during each 12-month period
prior to the reporting periods preceding January 1, 2013 and
January 1, 2012, respectively, and subsequently defaulted
during these reporting periods.
142 The PNC Financial Services Group, Inc. – Form 10-K