PNC Bank 2013 Annual Report Download - page 109
Download and view the complete annual report
Please find page 109 of the 2013 PNC Bank annual report below. You can navigate through the pages in the report by either clicking on the pages listed below, or by using the keyword search tool below to find specific information within the annual report.-
 1
1 -
2
-
3
-
4
-
5
-
6
-
7
-
8
-
9
-
10
-
11
-
12
-
13
-
14
-
15
-
16
-
17
-
18
-
19
-
20
-
21
-
22
-
23
-
24
-
25
-
26
-
27
-
28
-
29
-
30
-
31
-
32
-
33
-
34
-
35
-
36
-
37
-
38
-
39
-
40
-
41
-
42
-
43
-
44
-
45
-
46
-
47
-
48
-
49
-
50
-
51
-
52
-
53
-
54
-
55
-
56
-
57
-
58
-
59
-
60
-
61
-
62
-
63
-
64
-
65
-
66
-
67
-
68
-
69
-
70
-
71
-
72
-
73
-
74
-
75
-
76
-
77
-
78
-
79
-
80
-
81
-
82
-
83
-
84
-
85
-
86
-
87
-
88
-
89
-
90
-
91
-
92
-
93
-
94
-
95
-
96
-
97
-
98
-
 99
99 -
 100
100 -
 101
101 -
 102
102 -
 103
103 -
 104
104 -
 105
105 -
 106
106 -
 107
107 -
 108
108 -
 109
109 -
 110
110 -
 111
111 -
 112
112 -
 113
113 -
 114
114 -
 115
115 -
 116
116 -
 117
117 -
 118
118 -
 119
119 -
120
-
121
-
122
-
123
-
124
-
125
-
126
-
127
-
128
-
129
-
130
-
131
-
132
-
133
-
134
-
135
-
136
-
137
-
138
-
139
-
140
-
141
-
142
-
143
-
144
-
145
-
146
-
147
-
148
-
149
-
150
-
151
-
152
-
153
-
154
-
155
-
156
-
157
-
158
-
159
-
160
-
161
-
162
-
163
-
164
-
165
-
166
-
167
-
168
-
169
-
170
-
171
-
172
-
173
-
174
-
175
-
176
-
177
-
178
-
179
-
180
-
181
-
182
-
183
-
184
-
185
-
186
-
187
-
188
-
189
-
190
-
191
-
192
-
193
-
194
-
195
-
196
-
197
-
198
-
199
-
200
-
201
-
202
-
203
-
204
-
205
-
206
-
207
-
208
-
209
-
210
-
211
-
212
-
213
-
214
-
215
-
216
-
217
-
218
-
219
-
220
-
221
-
222
-
223
-
224
-
225
-
226
-
227
-
228
-
229
-
230
-
231
-
232
-
233
-
234
-
235
-
236
-
237
-
238
-
239
-
240
-
241
-
242
-
243
-
244
-
245
-
246
-
247
-
248
-
249
-
250
-
251
-
252
-
253
-
254
-
255
-
256
-
257
-
258
-
259
-
260
-
261
-
262
-
263
-
264
-
265
-
266
 |
 |

environment, including implied government support. In
addition, rating agencies themselves have been subject to
scrutiny arising from the financial crisis and could make or be
required to make substantial changes to their ratings policies
and practices, particularly in response to legislative and
regulatory changes, including as a result of provisions in
Dodd-Frank. Potential changes in the legislative and
regulatory environment and the timing of those changes could
impact our ratings, which as noted above, could impact our
liquidity and financial condition. A decrease, or potential
decrease, in credit ratings could impact access to the capital
markets and/or increase the cost of debt, and thereby
adversely affect liquidity and financial condition.
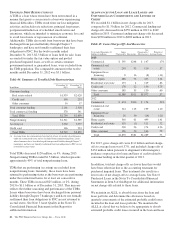
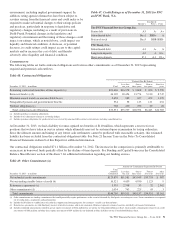
Table 47: Credit Ratings as of December 31, 2013 for PNC
and PNC Bank, N.A.
Moody’s
Standard &
Poor’s Fitch
The PNC Financial Services Group, Inc.
Senior debt A3 A- A+
Subordinated debt Baa1 BBB+ A
Preferred stock Baa3 BBB BBB-
PNC Bank, N.A.
Subordinated debt A3 A- A
Long-term deposits A2 A AA-
Short-term deposits P-1 A-1 F1+
C
OMMITMENTS
The following tables set forth contractual obligations and various other commitments as of December 31, 2013 representing
required and potential cash outflows.
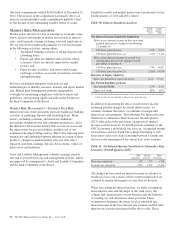
Table 48: Contractual Obligations
Payment Due By Period
December 31, 2013 – in millions Total
Less than
one year
One to
three years
Four to
five years
After five
years
Remaining contractual maturities of time deposits (a) $23,466 $16,378 $ 3,808 $ 690 $ 2,590
Borrowed funds (a) (b) 46,105 18,454 13,774 5,130 8,747
Minimum annual rentals on noncancellable leases 2,658 389 627 472 1,170
Nonqualified pension and postretirement benefits 534 58 113 111 252
Purchase obligations (c) 768 430 272 40 26
Total contractual cash obligations $73,531 $35,709 $18,594 $6,443 $12,785
(a) Includes purchase accounting adjustments.
(b) Includes basis adjustment relating to accounting hedges.
(c) Includes purchase obligations for goods and services covered by noncancellable contracts and contracts including cancellation fees.
At December 31, 2013, we had a liability for unrecognized tax benefits of $110 million, which represents a reserve for tax
positions that we have taken in our tax returns which ultimately may not be sustained upon examination by taxing authorities.
Since the ultimate amount and timing of any future cash settlements cannot be predicted with reasonable certainty, this estimated
liability has been excluded from the contractual obligations table. See Note 21 Income Taxes in the Notes To Consolidated
Financial Statements in Item 8 of this Report for additional information.
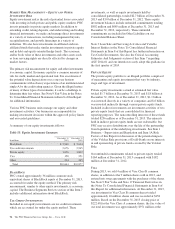
Our contractual obligations totaled $71.1 billion at December 31, 2012. The increase in the comparison is primarily attributable to
an increase in borrowed funds partially offset by the decline of time deposits. See Funding and Capital Sources in the Consolidated
Balance Sheet Review section of this Item 7 for additional information regarding our funding sources.
Table 49: Other Commitments (a)
Amount Of Commitment Expiration By Period
December 31, 2013 – in millions
Total
Amounts
Committed
Less than
one year
One to
three years
Four to
five years
After
five years
Net unfunded credit commitments $129,870 $51,581 $43,949 $33,753 $ 587
Net outstanding standby letters of credit (b) 10,521 4,459 4,930 1,123 9
Reinsurance agreements (c) 5,335 2,708 33 32 2,562
Other commitments (d) 1,034 763 225 43 3
Total commitments $146,760 $59,511 $49,137 $34,951 $3,161
(a) Other commitments are funding commitments that could potentially require performance in the event of demands by third parties or contingent events. Loan commitments are reported
net of syndications, assignments and participations.
(b) Includes $6.6 billion of standby letters of credit that support remarketing programs for customers’ variable rate demand notes.
(c) Reinsurance agreements are with third-party insurers related to insurance sold to our customers. Balances represent estimates based on availability of financial information.
(d) Includes unfunded commitments related to private equity investments of $164 million that are not on our Consolidated Balance Sheet. Also includes commitments related to tax credit
investments of $802 million and other direct equity investments of $68 million that are included in Other liabilities on our Consolidated Balance Sheet.
The PNC Financial Services Group, Inc. – Form 10-K 91