PNC Bank 2013 Annual Report Download - page 214
Download and view the complete annual report
Please find page 214 of the 2013 PNC Bank annual report below. You can navigate through the pages in the report by either clicking on the pages listed below, or by using the keyword search tool below to find specific information within the annual report.
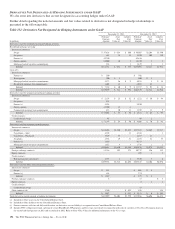
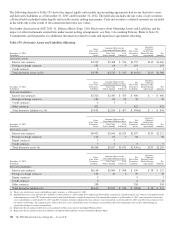
The following derivative Table 139 shows the impact legally enforceable master netting agreements had on our derivative assets
and derivative liabilities as of December 31, 2013 and December 31, 2012. The table also includes the fair value of any securities
collateral held or pledged under legally enforceable master netting agreements. Cash and securities collateral amounts are included
in the table only to the extent of the related net derivative fair values.
For further discussion on ASU 2011-11, Balance Sheet (Topic 210): Disclosures about Offsetting Assets and Liabilities and the
impact of other instruments entered into under master netting arrangements, see Note 1 Accounting Policies. Refer to Note 24
Commitments and Guarantees for additional information related to resale and repurchase agreements offsetting.
Table 139: Derivative Assets and Liabilities Offsetting
December 31, 2013
In millions
Gross
Fair Value
Derivative
Assets
Amounts Offset on the
Consolidated Balance Sheet Net
Fair Value
Derivative
Assets
Securities
Collateral
Held Under
Master Netting
Agreements
Net
Amounts
Fair Value
Offset Amount
Cash
Collateral
Derivative assets
Interest rate contracts $4,599 $2,468 $ 556 $1,575 $115 $1,460
Foreign exchange contracts 192 64 9 119 119
Credit contracts 2 1 1 1
Total derivative assets (a) (b) $4,793 $2,533 $ 565 $1,695(c) $115 $1,580
December 31, 2013
In millions
Gross
Fair Value
Derivative
Liabilities
Amounts Offset on the
Consolidated Balance Sheet Net
Fair Value
Derivative
Liabilities
Securities
Collateral
Pledged Under
Master Netting
Agreements
Net
Amounts
Fair Value
Offset Amount
Cash
Collateral
Derivative liabilities
Interest rate contracts $3,326 $2,447 $ 473 $ 406 $ – $ 406
Foreign exchange contracts 182 83 23 76 76
Credit contracts 4 3 1
Other contracts 422 422 422
Total derivative liabilities (a) (b) $3,934 $2,533 $ 497 $ 904(d) $ – $ 904
December 31, 2012
In millions
Gross
Fair Value
Derivative
Assets
Amounts Offset on the
Consolidated Balance Sheet Net
Fair Value
Derivative
Assets
Securities
Collateral
Held Under
Master Netting
Agreements
Net
Amounts
Fair Value
Offset Amount
Cash
Collateral
Derivative assets
Interest rate contracts $8,432 $5,041 $1,024 $2,367 $135 $2,232
Foreign exchange contracts 126 61 7 58 58
Equity contracts 3 3
Credit contracts 7 2 5 5
Total derivative assets (b) $8,568 $5,107 $1,031 $2,430(c) $135 $2,295
December 31, 2012
In millions
Gross
Fair Value
Derivative
Liabilities
Amounts Offset on the
Consolidated Balance Sheet Net
Fair Value
Derivative
Liabilities
Securities
Collateral
Pledged Under
Master Netting
Agreements
Net
Amounts
Fair Value
Offset Amount
Cash
Collateral
Derivative liabilities
Interest rate contracts $6,118 $5,060 $ 908 $ 150 $ 18 $ 132
Foreign exchange contracts 123 47 6 70 70
Equity contracts 5 5 5
Credit contracts 6 6 6
Other contracts 358 358 358
Total derivative liabilities (b) $6,610 $5,107 $ 914 $ 589(d) $ 18 $ 571
(a) There were no derivative assets and liabilities equity contracts as of December 31, 2013.
(b) Included derivative assets and derivative liabilities as of December 31, 2013 totaling $331 million and $224 million, respectively, related to interest rate contracts executed bilaterally
with counterparties in the OTC market and novated to and cleared through a central clearing house. The comparable amounts as of December 31, 2012 were not material. Derivative
assets and liabilities as of December 31, 2013 and 2012 related to exchange-traded interest rate contracts were not material. As of December 31, 2013 and 2012, these contracts were
not subject to offsetting. The remaining gross and net derivative assets and liabilities relate to contracts executed bilaterally with counterparties that are not settled through an
organized exchange or central clearing house.
(c) Represents the net amount of derivative assets included in Other assets on our Consolidated Balance Sheet.
(d) Represents the net amount of derivative liabilities included in Other liabilities on our Consolidated Balance Sheet.
196 The PNC Financial Services Group, Inc. – Form 10-K


