PNC Bank 2013 Annual Report Download - page 157
Download and view the complete annual report
Please find page 157 of the 2013 PNC Bank annual report below. You can navigate through the pages in the report by either clicking on the pages listed below, or by using the keyword search tool below to find specific information within the annual report.-
 1
1 -
2
-
3
-
4
-
5
-
6
-
7
-
8
-
9
-
10
-
11
-
12
-
13
-
14
-
15
-
16
-
17
-
18
-
19
-
20
-
21
-
22
-
23
-
24
-
25
-
26
-
27
-
28
-
29
-
30
-
31
-
32
-
33
-
34
-
35
-
36
-
37
-
38
-
39
-
40
-
41
-
42
-
43
-
44
-
45
-
46
-
47
-
48
-
49
-
50
-
51
-
52
-
53
-
54
-
55
-
56
-
57
-
58
-
59
-
60
-
61
-
62
-
63
-
64
-
65
-
66
-
67
-
68
-
69
-
70
-
71
-
72
-
73
-
74
-
75
-
76
-
77
-
78
-
79
-
80
-
81
-
82
-
83
-
84
-
85
-
86
-
87
-
88
-
89
-
90
-
91
-
92
-
93
-
94
-
95
-
96
-
97
-
98
-
99
-
100
-
101
-
102
-
103
-
104
-
105
-
106
-
107
-
108
-
109
-
110
-
111
-
112
-
113
-
114
-
115
-
116
-
117
-
118
-
119
-
120
-
121
-
122
-
123
-
124
-
125
-
126
-
127
-
128
-
129
-
130
-
131
-
132
-
133
-
134
-
135
-
136
-
137
-
138
-
139
-
140
-
141
-
142
-
143
-
144
-
145
-
146
-
 147
147 -
 148
148 -
 149
149 -
 150
150 -
 151
151 -
 152
152 -
 153
153 -
 154
154 -
 155
155 -
 156
156 -
 157
157 -
 158
158 -
 159
159 -
 160
160 -
 161
161 -
 162
162 -
 163
163 -
 164
164 -
 165
165 -
 166
166 -
 167
167 -
168
-
169
-
170
-
171
-
172
-
173
-
174
-
175
-
176
-
177
-
178
-
179
-
180
-
181
-
182
-
183
-
184
-
185
-
186
-
187
-
188
-
189
-
190
-
191
-
192
-
193
-
194
-
195
-
196
-
197
-
198
-
199
-
200
-
201
-
202
-
203
-
204
-
205
-
206
-
207
-
208
-
209
-
210
-
211
-
212
-
213
-
214
-
215
-
216
-
217
-
218
-
219
-
220
-
221
-
222
-
223
-
224
-
225
-
226
-
227
-
228
-
229
-
230
-
231
-
232
-
233
-
234
-
235
-
236
-
237
-
238
-
239
-
240
-
241
-
242
-
243
-
244
-
245
-
246
-
247
-
248
-
249
-
250
-
251
-
252
-
253
-
254
-
255
-
256
-
257
-
258
-
259
-
260
-
261
-
262
-
263
-
264
-
265
-
266
 |
 |

C
REDIT
C
ARD
A
ND
O
THER
C
ONSUMER
L
OAN
C
LASSES
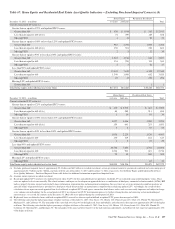
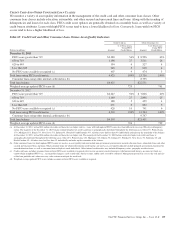
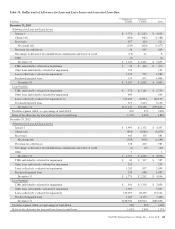
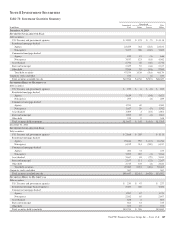
We monitor a variety of asset quality information in the management of the credit card and other consumer loan classes. Other
consumer loan classes include education, automobile, and other secured and unsecured lines and loans. Along with the trending of
delinquencies and losses for each class, FICO credit score updates are generally obtained on a monthly basis, as well as a variety of
credit bureau attributes. Loans with high FICO scores tend to have a lower likelihood of loss. Conversely, loans with low FICO
scores tend to have a higher likelihood of loss.
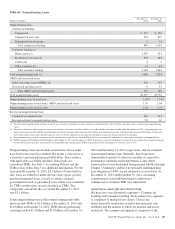
Table 69: Credit Card and Other Consumer Loan Classes Asset Quality Indicators
Credit Card (a) Other Consumer (b)
Dollars in millions Amount
% of Total Loans
Using FICO
Credit Metric Amount
% of Total Loans
Using FICO
Credit Metric
December 31, 2013
FICO score greater than 719 $2,380 54% $ 8,596 63%
650 to 719 1,198 27 3,511 26
620 to 649 194 4 527 4
Less than 620 246 6 628 4
No FICO score available or required (c) 407 9 474 3
Total loans using FICO credit metric 4,425 100% 13,736 100%
Consumer loans using other internal credit metrics (b) 8,795
Total loan balance $4,425 $22,531
Weighted-average updated FICO score (d) 729 741
December 31, 2012
FICO score greater than 719 $2,247 52% $ 7,006 60%
650 to 719 1,169 27 2,896 25
620 to 649 188 5 459 4
Less than 620 271 6 602 5
No FICO score available or required (c) 428 10 741 6
Total loans using FICO credit metric 4,303 100% 11,704 100%
Consumer loans using other internal credit metrics (b) 9,747
Total loan balance $4,303 $21,451
Weighted-average updated FICO score (d) 726 739
(a) At December 31, 2013, we had $34 million of credit card loans that are higher risk (i.e., loans with both updated FICO scores less than 660 and in late stage (90+ days) delinquency
status). The majority of the December 31, 2013 balance related to higher risk credit card loans is geographically distributed throughout the following areas: Ohio 18%, Pennsylvania
17%, Michigan 11%, Illinois 7%, New Jersey 7%, Indiana 6%, Florida 6% and Kentucky 4%. All other states had less than 4% individually and make up the remainder of the balance.
At December 31, 2012, we had $36 million of credit card loans that are higher risk. The majority of the December 31, 2012 balance related to higher risk credit card loans is
geographically distributed throughout the following areas: Ohio 18%, Pennsylvania 14%, Michigan 12%, Illinois 8%, Indiana 6%, Florida 6%, New Jersey 5%, Kentucky 4% and
North Carolina 4%. All other states had less than 3% individually and make up the remainder of the balance.
(b) Other consumer loans for which updated FICO scores are used as an asset quality indicator include non-government guaranteed or insured education loans, automobile loans and other
secured and unsecured lines and loans. Other consumer loans for which other internal credit metrics are used as an asset quality indicator include primarily government guaranteed or
insured education loans, as well as consumer loans to high net worth individuals. Other internal credit metrics may include delinquency status, geography or other factors.
(c) Credit card loans and other consumer loans with no FICO score available or required refers to new accounts issued to borrowers with limited credit history, accounts for which we
cannot obtain an updated FICO (e.g., recent profile changes), cards issued with a business name, and/or cards secured by collateral. Management proactively assesses the risk and size
of this loan portfolio and, when necessary, takes actions to mitigate the credit risk.
(d) Weighted-average updated FICO score excludes accounts with no FICO score available or required.
The PNC Financial Services Group, Inc. – Form 10-K 139