PNC Bank 2013 Annual Report Download - page 146
Download and view the complete annual report
Please find page 146 of the 2013 PNC Bank annual report below. You can navigate through the pages in the report by either clicking on the pages listed below, or by using the keyword search tool below to find specific information within the annual report.-
 1
1 -
2
-
3
-
4
-
5
-
6
-
7
-
8
-
9
-
10
-
11
-
12
-
13
-
14
-
15
-
16
-
17
-
18
-
19
-
20
-
21
-
22
-
23
-
24
-
25
-
26
-
27
-
28
-
29
-
30
-
31
-
32
-
33
-
34
-
35
-
36
-
37
-
38
-
39
-
40
-
41
-
42
-
43
-
44
-
45
-
46
-
47
-
48
-
49
-
50
-
51
-
52
-
53
-
54
-
55
-
56
-
57
-
58
-
59
-
60
-
61
-
62
-
63
-
64
-
65
-
66
-
67
-
68
-
69
-
70
-
71
-
72
-
73
-
74
-
75
-
76
-
77
-
78
-
79
-
80
-
81
-
82
-
83
-
84
-
85
-
86
-
87
-
88
-
89
-
90
-
91
-
92
-
93
-
94
-
95
-
96
-
97
-
98
-
99
-
100
-
101
-
102
-
103
-
104
-
105
-
106
-
107
-
108
-
109
-
110
-
111
-
112
-
113
-
114
-
115
-
116
-
117
-
118
-
119
-
120
-
121
-
122
-
123
-
124
-
125
-
126
-
127
-
128
-
129
-
130
-
131
-
132
-
133
-
134
-
135
-
 136
136 -
 137
137 -
 138
138 -
 139
139 -
 140
140 -
 141
141 -
 142
142 -
 143
143 -
 144
144 -
 145
145 -
 146
146 -
 147
147 -
 148
148 -
 149
149 -
 150
150 -
 151
151 -
 152
152 -
 153
153 -
 154
154 -
 155
155 -
 156
156 -
157
-
158
-
159
-
160
-
161
-
162
-
163
-
164
-
165
-
166
-
167
-
168
-
169
-
170
-
171
-
172
-
173
-
174
-
175
-
176
-
177
-
178
-
179
-
180
-
181
-
182
-
183
-
184
-
185
-
186
-
187
-
188
-
189
-
190
-
191
-
192
-
193
-
194
-
195
-
196
-
197
-
198
-
199
-
200
-
201
-
202
-
203
-
204
-
205
-
206
-
207
-
208
-
209
-
210
-
211
-
212
-
213
-
214
-
215
-
216
-
217
-
218
-
219
-
220
-
221
-
222
-
223
-
224
-
225
-
226
-
227
-
228
-
229
-
230
-
231
-
232
-
233
-
234
-
235
-
236
-
237
-
238
-
239
-
240
-
241
-
242
-
243
-
244
-
245
-
246
-
247
-
248
-
249
-
250
-
251
-
252
-
253
-
254
-
255
-
256
-
257
-
258
-
259
-
260
-
261
-
262
-
263
-
264
-
265
-
266
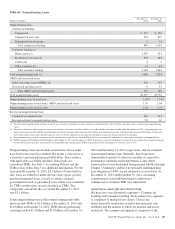
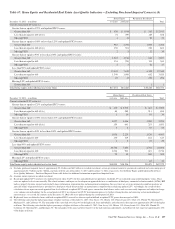
 |
 |

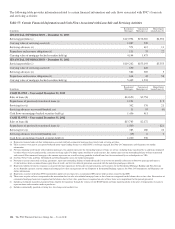
December 31, 2012 Credit Card Tax Credit
In millions Market Street Securitization Trust (e) Investments Total
Assets
Cash and due from banks $4 $ 4
Interest-earning deposits with banks 66
Investment securities $ 9 9
Loans 6,038 $1,743 7,781
Allowance for loan and lease losses (75) (75)
Equity investments 1,429 1,429
Other assets 536 31 714 1,281
Total assets $6,583 $1,699 $2,153 $10,435
Liabilities
Commercial paper $6,045 $ 6,045
Other borrowed funds $ 257 257
Accrued expenses 132 132
Other liabilities 529 447 976
Total liabilities $6,574 $ 836 $ 7,410
(a) Amounts represent carrying value on PNC’s Consolidated Balance Sheet.
(b) Difference between total assets and total liabilities represents the equity portion of the VIE or intercompany assets and liabilities which are eliminated in consolidation.
(c) During the fourth quarter of 2013, PNC finalized the wind down of Market Street. All commitments and loans of Market Street have been assigned to PNC Bank, National Association
(PNC Bank, N.A.).
(d) During the first quarter of 2013, PNC consolidated a Non-agency securitization trust due to modification of contractual provisions.
(e) During the first quarter of 2012, the last securitization series issued by the SPE matured, resulting in the zero balance of liabilities at December 31, 2012.
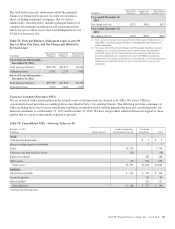
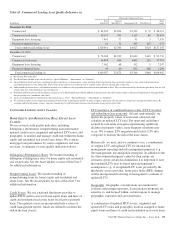
Table 60: Non-Consolidated VIEs
In millions
Aggregate
Assets
Aggregate
Liabilities
PNC
Risk of
Loss (a)
Carrying
Value of
Assets
Carrying
Value of
Liabilities
December 31, 2013
Commercial Mortgage-Backed Securitizations (b) $ 65,757 $ 65,757 $1,747 $1,747(d)
Residential Mortgage-Backed Securitizations (b) 37,962 37,962 4,171 4,171(d) $ 5(f)
Tax Credit Investments and Other (c) 7,086 2,622 2,134 2,160(e) 826(g)
Total $110,805 $106,341 $8,052 $8,078 $831
In millions
Aggregate
Assets
Aggregate
Liabilities
PNC
Risk of
Loss (a)
Carrying
Value of
Assets
Carrying
Value of
Liabilities
December 31, 2012
Commercial Mortgage-Backed Securitizations (b) $ 72,370 $ 72,370 $1,829 $1,829(d)
Residential Mortgage-Backed Securitizations (b) 42,719 42,719 5,456 5,456(d) $ 90(f)
Tax Credit Investments and Other (c) 6,232 2,375 1,536 1,555(e) 642(g)
Total $121,321 $117,464 $8,821 $8,840 $732
(a) This represents loans, investments and other assets related to non-consolidated VIEs, net of collateral (if applicable). Our total exposure related to our involvement in loan sale and
servicing activities is disclosed in Table 57. Additionally, we also invest in other mortgage and asset-backed securities issued by third-party VIEs with which we have no continuing
involvement. Further information on these securities is included in Note 8 Investment Securities and values disclosed represent our maximum exposure to loss for those securities’
holdings.
(b) Amounts reflect involvement with securitization SPEs where PNC transferred to and/or services loans for an SPE and we hold securities issued by that SPE. Asset amounts equal
outstanding liability amounts of the SPEs due to limited availability of SPE financial information.
(c) Aggregate assets and aggregate liabilities are based on limited availability of financial information associated with certain acquired partnerships and certain LLCs engaged in solar
power generation to which PNC provides lease financing. The aggregate assets and aggregate liabilities of LLCs engaged in solar power generation may not be reflective of the size of
these VIEs due to differences in classification of leases by these entities.
(d) Included in Trading securities, Investment securities, Other intangible assets and Other assets on our Consolidated Balance Sheet.
(e) Included in Loans, Equity investments and Other assets on our Consolidated Balance Sheet.
(f) Included in Other liabilities on our Consolidated Balance Sheet.
(g) Included in Deposits and Other liabilities on our Consolidated Balance Sheet.
128 The PNC Financial Services Group, Inc. – Form 10-K