PNC Bank 2013 Annual Report Download - page 53
Download and view the complete annual report
Please find page 53 of the 2013 PNC Bank annual report below. You can navigate through the pages in the report by either clicking on the pages listed below, or by using the keyword search tool below to find specific information within the annual report.-
 1
1 -
2
-
3
-
4
-
5
-
6
-
7
-
8
-
9
-
10
-
11
-
12
-
13
-
14
-
15
-
16
-
17
-
18
-
19
-
20
-
21
-
22
-
23
-
24
-
25
-
26
-
27
-
28
-
29
-
30
-
31
-
32
-
33
-
34
-
35
-
36
-
37
-
38
-
39
-
40
-
41
-
42
-
 43
43 -
 44
44 -
 45
45 -
 46
46 -
 47
47 -
 48
48 -
 49
49 -
 50
50 -
 51
51 -
 52
52 -
 53
53 -
 54
54 -
 55
55 -
 56
56 -
 57
57 -
 58
58 -
 59
59 -
 60
60 -
 61
61 -
 62
62 -
 63
63 -
64
-
65
-
66
-
67
-
68
-
69
-
70
-
71
-
72
-
73
-
74
-
75
-
76
-
77
-
78
-
79
-
80
-
81
-
82
-
83
-
84
-
85
-
86
-
87
-
88
-
89
-
90
-
91
-
92
-
93
-
94
-
95
-
96
-
97
-
98
-
99
-
100
-
101
-
102
-
103
-
104
-
105
-
106
-
107
-
108
-
109
-
110
-
111
-
112
-
113
-
114
-
115
-
116
-
117
-
118
-
119
-
120
-
121
-
122
-
123
-
124
-
125
-
126
-
127
-
128
-
129
-
130
-
131
-
132
-
133
-
134
-
135
-
136
-
137
-
138
-
139
-
140
-
141
-
142
-
143
-
144
-
145
-
146
-
147
-
148
-
149
-
150
-
151
-
152
-
153
-
154
-
155
-
156
-
157
-
158
-
159
-
160
-
161
-
162
-
163
-
164
-
165
-
166
-
167
-
168
-
169
-
170
-
171
-
172
-
173
-
174
-
175
-
176
-
177
-
178
-
179
-
180
-
181
-
182
-
183
-
184
-
185
-
186
-
187
-
188
-
189
-
190
-
191
-
192
-
193
-
194
-
195
-
196
-
197
-
198
-
199
-
200
-
201
-
202
-
203
-
204
-
205
-
206
-
207
-
208
-
209
-
210
-
211
-
212
-
213
-
214
-
215
-
216
-
217
-
218
-
219
-
220
-
221
-
222
-
223
-
224
-
225
-
226
-
227
-
228
-
229
-
230
-
231
-
232
-
233
-
234
-
235
-
236
-
237
-
238
-
239
-
240
-
241
-
242
-
243
-
244
-
245
-
246
-
247
-
248
-
249
-
250
-
251
-
252
-
253
-
254
-
255
-
256
-
257
-
258
-
259
-
260
-
261
-
262
-
263
-
264
-
265
-
266
 |
 |

B
USINESS
S
EGMENT
H
IGHLIGHTS
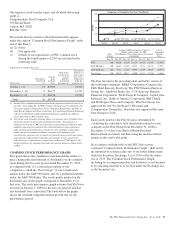
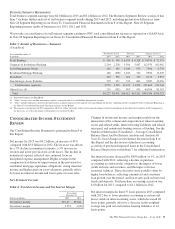
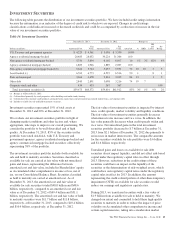
Total business segment earnings were $4.0 billion in 2013 and $3.4 billion in 2012. The Business Segments Review section of this
Item 7 includes further analysis of our business segment results during 2013 and 2012, including presentation differences from
Note 26 Segment Reporting in our Notes To Consolidated Financial Statements in Item 8 of this Report. Note 26 Segment
Reporting presents results of businesses for 2013, 2012 and 2011.
We provide a reconciliation of total business segment earnings to PNC total consolidated net income as reported on a GAAP basis
in Note 26 Segment Reporting in our Notes To Consolidated Financial Statements in Item 8 of this Report.
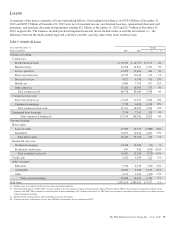
Table 3: Results of Businesses – Summary
(Unaudited)
Year ended December 31
In millions
Net Income (Loss) Revenue Average Assets (a)
2013 2012 2013 2012 2013 2012
Retail Banking $ 550 $ 596 $ 6,100 $ 6,328 $ 74,971 $ 72,573
Corporate & Institutional Banking 2,264 2,328 5,506 5,697 112,970 102,962
Asset Management Group 162 145 1,040 973 7,366 6,735
Residential Mortgage Banking 148 (308) 1,100 526 9,896 11,529
BlackRock 469 395 621 512 6,272 5,857
Non-Strategic Assets Portfolio 379 237 742 843 9,987 12,050
Total business segments 3,972 3,393 15,109 14,879 221,462 211,706
Other (b) (c) (d) 255 (392) 903 633 84,304 83,319
Total $4,227 $3,001 $16,012 $15,512 $305,766 $295,025
(a) Period-end balances for BlackRock.
(b) “Other” average assets include investment securities associated with asset and liability management activities.
(c) “Other” includes differences between the total business segment financial results and our total consolidated net income. Additional detail is included in Note 26 Segment Reporting in
the Notes To Consolidated Financial Statements in Item 8 of this Report.
(d) The increase in net income for 2013 compared to 2012 for “Other” primarily reflects lower noncash charges related to redemptions of trust preferred securities in 2013 compared to
the prior year, as well as the impact of integration costs recorded in 2012.
C
ONSOLIDATED
I
NCOME
S
TATEMENT
R
EVIEW
Our Consolidated Income Statement is presented in Item 8 of
this Report.
Net income for 2013 was $4.2 billion, an increase of 41%
compared with $3.0 billion for 2012. The increase was driven
by a 7% decline in noninterest expense, a 3% increase in
revenue and lower provision for credit losses. The decline in
noninterest expense reflected our continued focus on
disciplined expense management. Higher revenue in the
comparison was driven by improvement in the provision for
residential mortgage repurchase obligations, strong client fee
income and higher gains on asset valuations, partially offset
by lower net interest income and lower gains on asset sales.
N
ET
I
NTEREST
I
NCOME
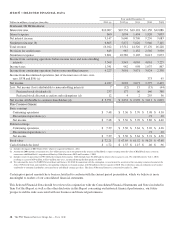
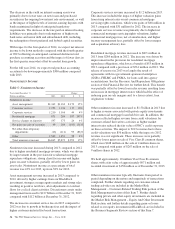
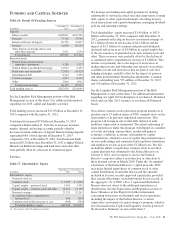
Table 4: Net Interest Income and Net Interest Margin
Year ended
December 31
Dollars in millions 2013 2012
Net interest income $9,147 $9,640
Net interest margin 3.57% 3.94%
Changes in net interest income and margin result from the
interaction of the volume and composition of interest-earning
assets and related yields, interest-bearing liabilities and related
rates paid, and noninterest-bearing sources of funding. See the
Statistical Information (Unaudited) – Average Consolidated
Balance Sheet And Net Interest Analysis and Analysis Of
Year-To-Year Changes in Net Interest Income in Item 8 of
this Report and the discussion of purchase accounting
accretion of purchased impaired loans in the Consolidated
Balance Sheet review in this Item 7 for additional information.
Net interest income decreased by $493 million, or 5%, in 2013
compared with 2012, reflecting a decline in purchase
accounting accretion in the comparison, the impact of lower
yields on loans and securities, and the impact of lower
securities balances. These decreases were partially offset by
higher loan balances, reflecting commercial and consumer
loan growth over the period, and lower rates paid on borrowed
funds and deposits. Total purchase accounting accretion was
$.8 billion for 2013 compared to $1.1 billion in 2012.
Net interest margin declined 37 basis points in 2013 compared
with 2012 due to lower purchase accounting accretion and
lower yields on interest-earning assets, which decreased 48
basis points, partially offset by a decrease in the weighted-
average rate paid on total interest-bearing liabilities of 14
basis points.
The PNC Financial Services Group, Inc. – Form 10-K 35