PNC Bank 2013 Annual Report Download - page 114
Download and view the complete annual report
Please find page 114 of the 2013 PNC Bank annual report below. You can navigate through the pages in the report by either clicking on the pages listed below, or by using the keyword search tool below to find specific information within the annual report.-
 1
1 -
2
-
3
-
4
-
5
-
6
-
7
-
8
-
9
-
10
-
11
-
12
-
13
-
14
-
15
-
16
-
17
-
18
-
19
-
20
-
21
-
22
-
23
-
24
-
25
-
26
-
27
-
28
-
29
-
30
-
31
-
32
-
33
-
34
-
35
-
36
-
37
-
38
-
39
-
40
-
41
-
42
-
43
-
44
-
45
-
46
-
47
-
48
-
49
-
50
-
51
-
52
-
53
-
54
-
55
-
56
-
57
-
58
-
59
-
60
-
61
-
62
-
63
-
64
-
65
-
66
-
67
-
68
-
69
-
70
-
71
-
72
-
73
-
74
-
75
-
76
-
77
-
78
-
79
-
80
-
81
-
82
-
83
-
84
-
85
-
86
-
87
-
88
-
89
-
90
-
91
-
92
-
93
-
94
-
95
-
96
-
97
-
98
-
99
-
100
-
101
-
102
-
103
-
 104
104 -
 105
105 -
 106
106 -
 107
107 -
 108
108 -
 109
109 -
 110
110 -
 111
111 -
 112
112 -
 113
113 -
 114
114 -
 115
115 -
 116
116 -
 117
117 -
 118
118 -
 119
119 -
 120
120 -
 121
121 -
 122
122 -
 123
123 -
 124
124 -
125
-
126
-
127
-
128
-
129
-
130
-
131
-
132
-
133
-
134
-
135
-
136
-
137
-
138
-
139
-
140
-
141
-
142
-
143
-
144
-
145
-
146
-
147
-
148
-
149
-
150
-
151
-
152
-
153
-
154
-
155
-
156
-
157
-
158
-
159
-
160
-
161
-
162
-
163
-
164
-
165
-
166
-
167
-
168
-
169
-
170
-
171
-
172
-
173
-
174
-
175
-
176
-
177
-
178
-
179
-
180
-
181
-
182
-
183
-
184
-
185
-
186
-
187
-
188
-
189
-
190
-
191
-
192
-
193
-
194
-
195
-
196
-
197
-
198
-
199
-
200
-
201
-
202
-
203
-
204
-
205
-
206
-
207
-
208
-
209
-
210
-
211
-
212
-
213
-
214
-
215
-
216
-
217
-
218
-
219
-
220
-
221
-
222
-
223
-
224
-
225
-
226
-
227
-
228
-
229
-
230
-
231
-
232
-
233
-
234
-
235
-
236
-
237
-
238
-
239
-
240
-
241
-
242
-
243
-
244
-
245
-
246
-
247
-
248
-
249
-
250
-
251
-
252
-
253
-
254
-
255
-
256
-
257
-
258
-
259
-
260
-
261
-
262
-
263
-
264
-
265
-
266
 |
 |

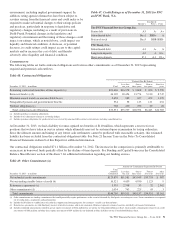
The following table summarizes the notional or contractual amounts and net fair value of financial derivatives at December 31,
2013 and December 31, 2012.
Table 56: Financial Derivatives Summary
December 31, 2013 December 31, 2012
In millions
Notional/
Contractual
Amount
Net Fair
Value (a)
Notional/
Contractual
Amount
Net Fair
Value (a)
Derivatives designated as hedging instruments under GAAP
Total derivatives designated as hedging instruments $ 36,197 $ 825 $ 29,270 $1,720
Derivatives not designated as hedging instruments under GAAP
Total derivatives used for residential mortgage banking activities $119,679 $ 330 $166,819 $ 588
Total derivatives used for commercial mortgage banking activities 53,149 (12) 4,606 (23)
Total derivatives used for customer-related activities 169,534 138 163,848 30
Total derivatives used for other risk management activities 2,697 (422) 1,813 (357)
Total derivatives not designated as hedging instruments $345,059 $ 34 $337,086 $ 238
Total Derivatives $381,256 $ 859 $366,356 $1,958
(a) Represents the net fair value of assets and liabilities.
2012 V
ERSUS
2011
C
ONSOLIDATED
I
NCOME
S
TATEMENT
R
EVIEW
Summary Results
Net income for 2012 was $3.0 billion, or $5.30 per diluted
common share, compared with $3.1 billion, or $5.64 per
diluted common share, for 2011. Revenue growth of 8% and a
decline in the provision for credit losses were more than offset
by a 16% increase in noninterest expense in 2012 compared to
2011.
Net Interest Income
Net interest income increased to $9.6 billion in 2012
compared with $8.7 billion in 2011, primarily due to the
impact of the RBC Bank (USA) acquisition, organic loan
growth and lower funding costs.
The net interest margin remained relatively flat at 3.94% in
2012 compared with 3.92% in 2011. The modest increase in
the comparison was primarily due to a decrease in the
weighted-average rate paid on total interest-bearing liabilities,
primarily due to the runoff of maturing retail certificates of
deposit and the redemption of additional trust preferred and
hybrid capital securities during 2012, in addition to an
increase in FHLB borrowings and commercial paper as lower-
cost funding sources. This impact was mostly offset by a
decrease in the yield on total interest-earning assets, which
reflected lower rates on new loan volume and lower yields on
new securities.
Noninterest Income
Noninterest income increased to $5.9 billion in 2012
compared with $5.6 billion in 2011. The overall increase in
the comparison was primarily due to an increase in residential
mortgage loan sales revenue driven by higher loan origination
volume, gains on sales of Visa Class B common shares and
higher corporate service fees, largely offset by higher
provision for residential mortgage repurchase obligations.
Noninterest income as a percentage of total revenue was 38%
in 2012 compared with 39% in 2011.
Asset management revenue increased to $1.2 billion in 2012
compared with $1.1 billion in 2011, primarily due to higher
earnings from our BlackRock investment. Discretionary assets
under management increased to $112 billion at December 31,
2012 compared with $107 billion at December 31, 2011
driven by stronger average equity markets, positive net flows,
after adjustments to total net flows for cyclical client
activities, and strong sales performance.
Consumer services fees declined to $1.1 billion compared
with $1.2 billion in 2011. The decline reflected the regulatory
impact of lower interchange fees on debit card transactions
partially offset by customer growth. As further discussed in
the Retail Banking portion of the Business Segments Review
section of Item 7 in our 2012 Form 10-K, the Dodd-Frank
limits on interchange rates were effective October 1, 2011 and
had a negative impact on revenue of approximately $314
million in 2012 and $75 million in 2011. This impact was
partially offset by higher volumes of merchant, customer
credit card and debit card transactions and the impact of the
RBC Bank (USA) acquisition.
Corporate services revenue increased by $.3 billion, or 30%,
to $1.2 billion in 2012 compared with $.9 billion in 2011 due
to higher commercial mortgage servicing revenue and higher
merger and acquisition advisory fees in 2012. The comparison
also reflected the impact of valuation gains from rising interest
rates on commercial mortgage servicing rights valuations,
which were $31 million in 2012 compared to a loss of $152
million in 2011.
96 The PNC Financial Services Group, Inc. – Form 10-K