PNC Bank 2013 Annual Report Download - page 63
Download and view the complete annual report
Please find page 63 of the 2013 PNC Bank annual report below. You can navigate through the pages in the report by either clicking on the pages listed below, or by using the keyword search tool below to find specific information within the annual report.-
 1
1 -
2
-
3
-
4
-
5
-
6
-
7
-
8
-
9
-
10
-
11
-
12
-
13
-
14
-
15
-
16
-
17
-
18
-
19
-
20
-
21
-
22
-
23
-
24
-
25
-
26
-
27
-
28
-
29
-
30
-
31
-
32
-
33
-
34
-
35
-
36
-
37
-
38
-
39
-
40
-
41
-
42
-
43
-
44
-
45
-
46
-
47
-
48
-
49
-
50
-
51
-
52
-
 53
53 -
 54
54 -
 55
55 -
 56
56 -
 57
57 -
 58
58 -
 59
59 -
 60
60 -
 61
61 -
 62
62 -
 63
63 -
 64
64 -
 65
65 -
 66
66 -
 67
67 -
 68
68 -
 69
69 -
 70
70 -
 71
71 -
 72
72 -
 73
73 -
74
-
75
-
76
-
77
-
78
-
79
-
80
-
81
-
82
-
83
-
84
-
85
-
86
-
87
-
88
-
89
-
90
-
91
-
92
-
93
-
94
-
95
-
96
-
97
-
98
-
99
-
100
-
101
-
102
-
103
-
104
-
105
-
106
-
107
-
108
-
109
-
110
-
111
-
112
-
113
-
114
-
115
-
116
-
117
-
118
-
119
-
120
-
121
-
122
-
123
-
124
-
125
-
126
-
127
-
128
-
129
-
130
-
131
-
132
-
133
-
134
-
135
-
136
-
137
-
138
-
139
-
140
-
141
-
142
-
143
-
144
-
145
-
146
-
147
-
148
-
149
-
150
-
151
-
152
-
153
-
154
-
155
-
156
-
157
-
158
-
159
-
160
-
161
-
162
-
163
-
164
-
165
-
166
-
167
-
168
-
169
-
170
-
171
-
172
-
173
-
174
-
175
-
176
-
177
-
178
-
179
-
180
-
181
-
182
-
183
-
184
-
185
-
186
-
187
-
188
-
189
-
190
-
191
-
192
-
193
-
194
-
195
-
196
-
197
-
198
-
199
-
200
-
201
-
202
-
203
-
204
-
205
-
206
-
207
-
208
-
209
-
210
-
211
-
212
-
213
-
214
-
215
-
216
-
217
-
218
-
219
-
220
-
221
-
222
-
223
-
224
-
225
-
226
-
227
-
228
-
229
-
230
-
231
-
232
-
233
-
234
-
235
-
236
-
237
-
238
-
239
-
240
-
241
-
242
-
243
-
244
-
245
-
246
-
247
-
248
-
249
-
250
-
251
-
252
-
253
-
254
-
255
-
256
-
257
-
258
-
259
-
260
-
261
-
262
-
263
-
264
-
265
-
266
 |
 |

F
UNDING AND
C
APITAL
S
OURCES
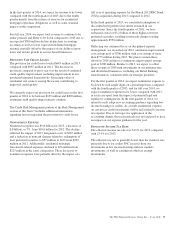
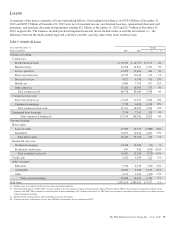
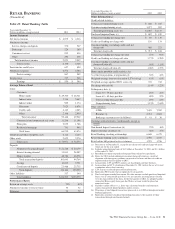
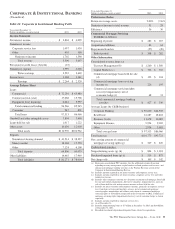
Table 16: Details Of Funding Sources
In millions
December 31
2013
December 31
2012
Deposits
Money market $108,631 $102,706
Demand 77,756 73,995
Retail certificates of deposit 20,795 23,837
Savings 11,078 10,350
Time deposits in foreign offices and
other time deposits 2,671 2,254
Total deposits 220,931 213,142
Borrowed funds
Federal funds purchased and
repurchase agreements 4,289 3,327
Federal Home Loan Bank borrowings 12,912 9,437
Bank notes and senior debt 12,603 10,429
Subordinated debt 8,244 7,299
Commercial paper 4,997 8,453
Other 3,060 1,962
Total borrowed funds 46,105 40,907
Total funding sources $267,036 $254,049
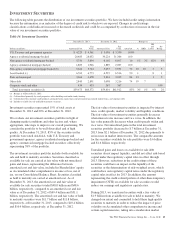
See the Liquidity Risk Management portion of the Risk
Management section of this Item 7 for additional information
regarding our 2013 capital and liquidity activities.
Total funding sources increased $13.0 billion at December 31,
2013 compared with December 31, 2012.
Total deposits increased $7.8 billion at December 31, 2013
compared with December 31, 2012 due to increases in money
market, demand, and savings accounts, partially offset by
decreases in retail certificates of deposit. Interest-bearing deposits
represented 68% of total deposits at December 31, 2013
compared to 67% at December 31, 2012. Total borrowed funds
increased $5.2 billion since December 31, 2012 as higher Federal
Home Loan Bank borrowings and bank notes and senior debt
were partially offset by a decrease in commercial paper.
C
APITAL
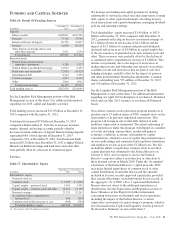
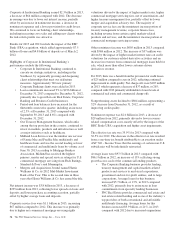
Table 17: Shareholders’ Equity
In millions
December 31
2013
December 31
2012
Shareholders’ equity
Preferred stock (a)
Common stock $ 2,698 $ 2,690
Capital surplus – preferred stock 3,941 3,590
Capital surplus – common stock and other 12,416 12,193
Retained earnings 23,325 20,265
Accumulated other comprehensive
income (loss) 436 834
Common stock held in treasury at cost (408) (569)
Total shareholders’ equity $42,408 $39,003
(a) Par value less than $.5 million at each date.
We manage our funding and capital positions by making
adjustments to our balance sheet size and composition, issuing
debt, equity or other capital instruments, executing treasury
stock transactions and capital redemptions, managing dividend
policies and retaining earnings.
Total shareholders’ equity increased $3.4 billion, to $42.4
billion at December 31, 2013 compared with December 31,
2012, primarily reflecting an increase in retained earnings of
$3.1 billion (driven by net income of $4.2 billion and the
impact of $1.1 billion of common and preferred dividends
declared) and an increase of $.6 billion in capital surplus due
to the net issuances of preferred stock and common stock and
other. These increases were partially offset by the decline of
accumulated other comprehensive income of $.4 billion. This
decline was primarily due to the impact of an increase in
market interest rates and widening asset spreads on securities
available for sale and derivatives that are part of cash flow
hedging strategies, partially offset by the impact of pension
and other postretirement benefit plan adjustments. Common
shares outstanding were 533 million at December 31, 2013
and 528 million at December 31, 2012.
See the Liquidity Risk Management portion of the Risk
Management section of this Item 7 for additional information
regarding our April 2013 redemption of our Series L Preferred
Stock and our May 2013 issuance of our Series R Preferred
Stock.
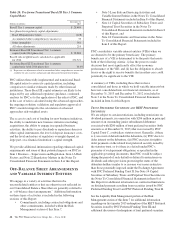
Our current common stock repurchase program permits us to
purchase up to 25 million shares of PNC common stock on the
open market or in privately negotiated transactions. This
program will remain in effect until fully utilized or until
modified, superseded or terminated. The extent and timing of
share repurchases under this program will depend on a number
of factors including, among others, market and general
economic conditions, economic and regulatory capital
considerations, alternative uses of capital, the potential impact
on our credit ratings and contractual and regulatory limitations
and regulatory review as part of the CCAR process. We did
include the ability to repurchase common stock in our 2014
capital plan that was submitted to the Federal Reserve on
January 6, 2014, and we expect to receive the Federal
Reserve’s response (either a non-objection or objection) to
these planned actions in March 2014. Under the “de minimis”
safe harbor of the Federal Reserve’s capital plan rule, PNC
may make limited repurchases of common stock or other
capital distributions in amounts that exceed the amounts
included in its most recently approved capital plan, provided
that, among other things, such distributions do not exceed, in
the aggregate, 1% of PNC’s Tier 1 capital and the Federal
Reserve does not object to the additional repurchases or
distributions. See the Supervision and Regulation section of
Item 1 Business in this Report for further information
concerning restrictions on dividends and stock repurchases,
including the impact of the Federal Reserve’s current
supervisory assessment of capital adequacy program, which is
also discussed in the Capital and Liquidity Actions portion of
the Executive Summary section of this Item 7.
The PNC Financial Services Group, Inc. – Form 10-K 45