PNC Bank 2013 Annual Report Download - page 179
Download and view the complete annual report
Please find page 179 of the 2013 PNC Bank annual report below. You can navigate through the pages in the report by either clicking on the pages listed below, or by using the keyword search tool below to find specific information within the annual report.-
 1
1 -
2
-
3
-
4
-
5
-
6
-
7
-
8
-
9
-
10
-
11
-
12
-
13
-
14
-
15
-
16
-
17
-
18
-
19
-
20
-
21
-
22
-
23
-
24
-
25
-
26
-
27
-
28
-
29
-
30
-
31
-
32
-
33
-
34
-
35
-
36
-
37
-
38
-
39
-
40
-
41
-
42
-
43
-
44
-
45
-
46
-
47
-
48
-
49
-
50
-
51
-
52
-
53
-
54
-
55
-
56
-
57
-
58
-
59
-
60
-
61
-
62
-
63
-
64
-
65
-
66
-
67
-
68
-
69
-
70
-
71
-
72
-
73
-
74
-
75
-
76
-
77
-
78
-
79
-
80
-
81
-
82
-
83
-
84
-
85
-
86
-
87
-
88
-
89
-
90
-
91
-
92
-
93
-
94
-
95
-
96
-
97
-
98
-
99
-
100
-
101
-
102
-
103
-
104
-
105
-
106
-
107
-
108
-
109
-
110
-
111
-
112
-
113
-
114
-
115
-
116
-
117
-
118
-
119
-
120
-
121
-
122
-
123
-
124
-
125
-
126
-
127
-
128
-
129
-
130
-
131
-
132
-
133
-
134
-
135
-
136
-
137
-
138
-
139
-
140
-
141
-
142
-
143
-
144
-
145
-
146
-
147
-
148
-
149
-
150
-
151
-
152
-
153
-
154
-
155
-
156
-
157
-
158
-
159
-
160
-
161
-
162
-
163
-
164
-
165
-
166
-
167
-
168
-
 169
169 -
 170
170 -
 171
171 -
 172
172 -
 173
173 -
 174
174 -
 175
175 -
 176
176 -
 177
177 -
 178
178 -
 179
179 -
 180
180 -
 181
181 -
 182
182 -
 183
183 -
 184
184 -
 185
185 -
 186
186 -
 187
187 -
 188
188 -
 189
189 -
190
-
191
-
192
-
193
-
194
-
195
-
196
-
197
-
198
-
199
-
200
-
201
-
202
-
203
-
204
-
205
-
206
-
207
-
208
-
209
-
210
-
211
-
212
-
213
-
214
-
215
-
216
-
217
-
218
-
219
-
220
-
221
-
222
-
223
-
224
-
225
-
226
-
227
-
228
-
229
-
230
-
231
-
232
-
233
-
234
-
235
-
236
-
237
-
238
-
239
-
240
-
241
-
242
-
243
-
244
-
245
-
246
-
247
-
248
-
249
-
250
-
251
-
252
-
253
-
254
-
255
-
256
-
257
-
258
-
259
-
260
-
261
-
262
-
263
-
264
-
265
-
266
 |
 |

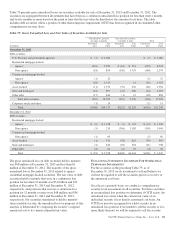
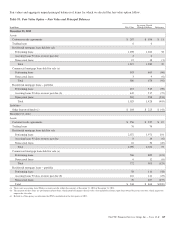
(a) Included in Other assets on our Consolidated Balance Sheet.
(b) Amounts at December 31, 2013 and December 31, 2012 are presented gross and are not reduced by the impact of legally enforceable master netting agreements that allow PNC to net
positive and negative positions and cash collateral held or placed with the same counterparty. The net asset amounts were $1.7 billion at December 31, 2013 compared with $2.4
billion at December 31, 2012 and the net liability amounts were $.9 billion and $.6 billion, respectively.
(c) Included in Loans held for sale on our Consolidated Balance Sheet. PNC has elected the fair value option for certain residential and commercial mortgage loans held for sale.
(d) Fair value includes net unrealized gains of $11 million at December 31, 2013 compared with net unrealized gains of $59 million at December 31, 2012.
(e) Approximately 17% of these securities are residential mortgage-backed securities and 69% are U.S. Treasury and government agencies securities at December 31, 2013. Comparable
amounts at December 31, 2012 were 25% and 52%, respectively.
(f) Included in Other intangible assets on our Consolidated Balance Sheet.
(g) The indirect equity funds are not redeemable, but PNC receives distributions over the life of the partnership from liquidation of the underlying investments by the investee, which we
expect to occur over the next twelve years. The amount of unfunded contractual commitments related to indirect equity investments was $128 million and related to direct equity
investments was $36 million as of December 31, 2013, respectively.
(h) Included in Federal funds sold and resale agreements on our Consolidated Balance Sheet. PNC has elected the fair value option for these items.
(i) Included in Loans on our Consolidated Balance Sheet.
(j) PNC has elected the fair value option for these shares.
(k) Included in Other liabilities on our Consolidated Balance Sheet.
(l) Included in Other borrowed funds on our Consolidated Balance Sheet.
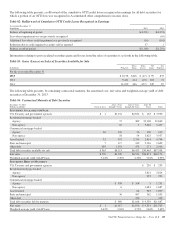
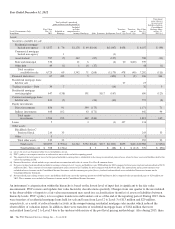
Reconciliations of assets and liabilities measured at fair value on a recurring basis using Level 3 inputs for 2013 and 2012 follow.
Table 88: Reconciliation of Level 3 Assets and Liabilities
Year Ended December 31, 2013
Total realized / unrealized
gains or losses for the period (a)
Unrealized
gains (losses)
on assets and
liabilities held on
Consolidated
Balance Sheet
at Dec. 31,
2013 (c)
Level 3 Instruments Only
In millions
Fair Value
Dec. 31,
2012
Included in
Earnings
Included
in Other
comprehensive
income Purchases Sales Issuances Settlements
Transfers
into
Level 3 (b)
Transfers
out of
Level 3 (b)
Fair Value
Dec. 31,
2013
Assets
Securities available for sale
Residential mortgage-
backed non-agency $ 6,107 $ 189 $147 $(1,085) $ 5,358 $ (10)
Commercial mortgage-
backed non-agency 3 (3)
Asset-backed 708 9 53 (129) 641 (6)
State and municipal 339 1 2 $ 4 (13) 333
Other debt 48 3 $ (10) (3) 38
Total securities
available for sale 7,202 202 202 7 (10) (1,233) 6,370 (16)
Financial derivatives 106 297 4 (369) $ (2) 36 166
Residential mortgage loans
held for sale 27 2 61 (3) 4 $ 13 (96) 8 2
Trading securities – Debt 32 32
Residential mortgage
servicing rights 650 366 110 (4) $158 (193) 1,087 354
Commercial mortgage loans
held for sale 772 (11) (130) (45) 586 (12)
Equity investments
Direct investments 1,171 141 177 (420) 1,069 62
Indirect investments 642 81 (3) 26 (151) 595 76
Total equity investments 1,813 222 (3) 203 (571) 1,664 138
Loans 134 46 1 (1) 83 277 (28) 512 34
Other assets
BlackRock Series C
Preferred Stock 243 122 (33) 332 122
Other 9 (1) 8
Total other assets 252 122 (1) (33) 340 122
Total assets $10,988 $1,246(e) $198 $386 $(719) $158 $(1,786) $290 $(126) $10,635 $788(f)
Liabilities
Financial derivatives (d) $ 376 $ 317 $ 2 $ (256) $ 439 $181
Other borrowed funds 9 175 184
Total liabilities $ 376 $ 326(e) $ 2 $ (81) $ 623 $181(f)
The PNC Financial Services Group, Inc. – Form 10-K 161