PNC Bank 2013 Annual Report Download - page 191
Download and view the complete annual report
Please find page 191 of the 2013 PNC Bank annual report below. You can navigate through the pages in the report by either clicking on the pages listed below, or by using the keyword search tool below to find specific information within the annual report.-
 1
1 -
2
-
3
-
4
-
5
-
6
-
7
-
8
-
9
-
10
-
11
-
12
-
13
-
14
-
15
-
16
-
17
-
18
-
19
-
20
-
21
-
22
-
23
-
24
-
25
-
26
-
27
-
28
-
29
-
30
-
31
-
32
-
33
-
34
-
35
-
36
-
37
-
38
-
39
-
40
-
41
-
42
-
43
-
44
-
45
-
46
-
47
-
48
-
49
-
50
-
51
-
52
-
53
-
54
-
55
-
56
-
57
-
58
-
59
-
60
-
61
-
62
-
63
-
64
-
65
-
66
-
67
-
68
-
69
-
70
-
71
-
72
-
73
-
74
-
75
-
76
-
77
-
78
-
79
-
80
-
81
-
82
-
83
-
84
-
85
-
86
-
87
-
88
-
89
-
90
-
91
-
92
-
93
-
94
-
95
-
96
-
97
-
98
-
99
-
100
-
101
-
102
-
103
-
104
-
105
-
106
-
107
-
108
-
109
-
110
-
111
-
112
-
113
-
114
-
115
-
116
-
117
-
118
-
119
-
120
-
121
-
122
-
123
-
124
-
125
-
126
-
127
-
128
-
129
-
130
-
131
-
132
-
133
-
134
-
135
-
136
-
137
-
138
-
139
-
140
-
141
-
142
-
143
-
144
-
145
-
146
-
147
-
148
-
149
-
150
-
151
-
152
-
153
-
154
-
155
-
156
-
157
-
158
-
159
-
160
-
161
-
162
-
163
-
164
-
165
-
166
-
167
-
168
-
169
-
170
-
171
-
172
-
173
-
174
-
175
-
176
-
177
-
178
-
179
-
180
-
 181
181 -
 182
182 -
 183
183 -
 184
184 -
 185
185 -
 186
186 -
 187
187 -
 188
188 -
 189
189 -
 190
190 -
 191
191 -
 192
192 -
 193
193 -
 194
194 -
 195
195 -
 196
196 -
 197
197 -
 198
198 -
 199
199 -
 200
200 -
 201
201 -
202
-
203
-
204
-
205
-
206
-
207
-
208
-
209
-
210
-
211
-
212
-
213
-
214
-
215
-
216
-
217
-
218
-
219
-
220
-
221
-
222
-
223
-
224
-
225
-
226
-
227
-
228
-
229
-
230
-
231
-
232
-
233
-
234
-
235
-
236
-
237
-
238
-
239
-
240
-
241
-
242
-
243
-
244
-
245
-
246
-
247
-
248
-
249
-
250
-
251
-
252
-
253
-
254
-
255
-
256
-
257
-
258
-
259
-
260
-
261
-
262
-
263
-
264
-
265
-
266
 |
 |

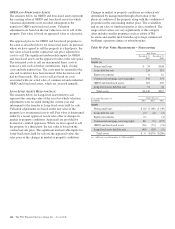
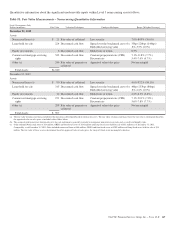
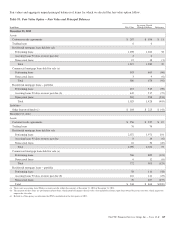
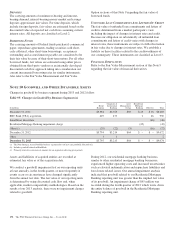
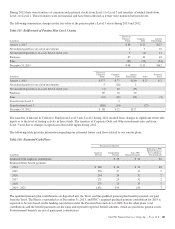
The gross carrying amount, accumulated amortization and net
carrying amount of other intangible assets by major category
consisted of the following:
Table 96: Other Intangible Assets
In millions
December 31
2013
December 31
2012
Customer-related and other intangibles
Gross carrying amount $ 1,676 $1,676
Accumulated amortization (1,096) (950)
Net carrying amount $ 580 $ 726
Mortgage and other loan servicing rights
Gross carrying amount $ 2,620 $2,071
Valuation allowance (88) (176)
Accumulated amortization (896) (824)
Net carrying amount (a) $ 1,636 $1,071
Total $ 2,216 $1,797
(a) Included mortgage servicing rights for other loan portfolios of less than $1 million at
December 31, 2013 and $1 million at December 31, 2012, respectively.
Our other intangible assets have finite lives and are amortized
primarily on a straight-line basis. Core deposit intangibles are
amortized on an accelerated basis.
For customer-related and other intangibles, the estimated
remaining useful lives range from less than 1 year to 10 years,
with a weighted-average remaining useful life of 7 years.
Amortization expense on existing intangible assets follows:
Table 97: Amortization Expense on Existing Intangible
Assets (a) (b)
In millions
2011 $324
2012 310
2013 243
2014 127
2015 110
2016 93
2017 79
2018 68
(a) Included mortgage servicing rights for other loan portfolios of $1 million at both
December 31, 2011 and 2012 and less than $1 million at December 31, 2013.
(b) Amounts for 2011, 2012 and 2013 include amortization expense related to
commercial MSRs. As of January 1, 2014, PNC made an irrevocable election to
subsequently measure all classes of commercial MSRs at fair value. Accordingly,
the estimated aggregate amortization expense for each of the five succeeding fiscal
years presented excludes amortization expense related to commercial MSRs. For
additional information regarding the election of commercial MSRs at fair value, see
Note 1 Accounting Policies for more detail.
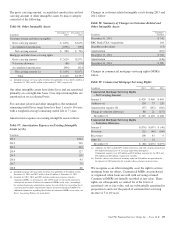
Changes in customer-related intangible assets during 2013 and
2012 follow:
Table 98: Summary of Changes in Customer-Related and
Other Intangible Assets
In millions
Customer-
Related
December 31, 2011 $ 742
RBC Bank (USA) Acquisition 164
SmartStreet divestiture (13)
Amortization (167)
December 31, 2012 $ 726
Amortization (146)
December 31, 2013 $ 580
Changes in commercial mortgage servicing rights (MSRs)
follow:
Table 99: Commercial Mortgage Servicing Rights
In millions 2013 2012 2011
Commercial Mortgage Servicing Rights
– Net Carrying Amount
January 1 $ 420 $ 468 $ 665
Additions (a) 138 73 120
Amortization expense (b) (97) (142) (160)
Change in valuation allowance 88 21 (157)
December 31 $ 549 $ 420 $ 468
Commercial Mortgage Servicing Rights
– Valuation Allowance
January 1 $(176) $(197) $ (40)
Provision (21) (46) (166)
Recoveries 108 43 9
Other (b) 1 24
December 31 $ (88) $(176) $(197)
(a) Additions for 2013 included $53 million from loans sold with servicing retained and
$85 million from purchases of servicing rights from third parties.
Comparable amounts were $45 million and $28 million, respectively, for 2012 and
$55 million and $65 million, respectively, for 2011.
(b) Includes a direct write-down of servicing rights for $24 million recognized in the
first quarter of 2012 primarily due to market-driven changes in interest rates.
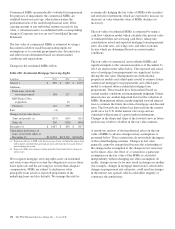
We recognize as an other intangible asset the right to service
mortgage loans for others. Commercial MSRs are purchased
or originated when loans are sold with servicing retained.
Commercial MSRs are initially recorded at fair value. These
rights are subsequently accounted for at the lower of
amortized cost or fair value, and are substantially amortized in
proportion to and over the period of estimated net servicing
income of 5 to 10 years.
The PNC Financial Services Group, Inc. – Form 10-K 173