PNC Bank 2013 Annual Report Download - page 117
Download and view the complete annual report
Please find page 117 of the 2013 PNC Bank annual report below. You can navigate through the pages in the report by either clicking on the pages listed below, or by using the keyword search tool below to find specific information within the annual report.-
 1
1 -
2
-
3
-
4
-
5
-
6
-
7
-
8
-
9
-
10
-
11
-
12
-
13
-
14
-
15
-
16
-
17
-
18
-
19
-
20
-
21
-
22
-
23
-
24
-
25
-
26
-
27
-
28
-
29
-
30
-
31
-
32
-
33
-
34
-
35
-
36
-
37
-
38
-
39
-
40
-
41
-
42
-
43
-
44
-
45
-
46
-
47
-
48
-
49
-
50
-
51
-
52
-
53
-
54
-
55
-
56
-
57
-
58
-
59
-
60
-
61
-
62
-
63
-
64
-
65
-
66
-
67
-
68
-
69
-
70
-
71
-
72
-
73
-
74
-
75
-
76
-
77
-
78
-
79
-
80
-
81
-
82
-
83
-
84
-
85
-
86
-
87
-
88
-
89
-
90
-
91
-
92
-
93
-
94
-
95
-
96
-
97
-
98
-
99
-
100
-
101
-
102
-
103
-
104
-
105
-
106
-
 107
107 -
 108
108 -
 109
109 -
 110
110 -
 111
111 -
 112
112 -
 113
113 -
 114
114 -
 115
115 -
 116
116 -
 117
117 -
 118
118 -
 119
119 -
 120
120 -
 121
121 -
 122
122 -
 123
123 -
 124
124 -
 125
125 -
 126
126 -
 127
127 -
128
-
129
-
130
-
131
-
132
-
133
-
134
-
135
-
136
-
137
-
138
-
139
-
140
-
141
-
142
-
143
-
144
-
145
-
146
-
147
-
148
-
149
-
150
-
151
-
152
-
153
-
154
-
155
-
156
-
157
-
158
-
159
-
160
-
161
-
162
-
163
-
164
-
165
-
166
-
167
-
168
-
169
-
170
-
171
-
172
-
173
-
174
-
175
-
176
-
177
-
178
-
179
-
180
-
181
-
182
-
183
-
184
-
185
-
186
-
187
-
188
-
189
-
190
-
191
-
192
-
193
-
194
-
195
-
196
-
197
-
198
-
199
-
200
-
201
-
202
-
203
-
204
-
205
-
206
-
207
-
208
-
209
-
210
-
211
-
212
-
213
-
214
-
215
-
216
-
217
-
218
-
219
-
220
-
221
-
222
-
223
-
224
-
225
-
226
-
227
-
228
-
229
-
230
-
231
-
232
-
233
-
234
-
235
-
236
-
237
-
238
-
239
-
240
-
241
-
242
-
243
-
244
-
245
-
246
-
247
-
248
-
249
-
250
-
251
-
252
-
253
-
254
-
255
-
256
-
257
-
258
-
259
-
260
-
261
-
262
-
263
-
264
-
265
-
266
 |
 |

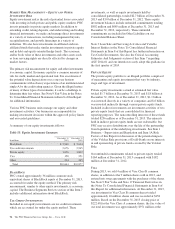
Interest-bearing deposits represented 67% of total deposits at
December 31, 2012 compared to 69% at December 31, 2011.
Average total deposits increased by $18.5 billion to $201.6 billion
in 2012 compared with 2011. This increase primarily resulted
from an increase in average transaction deposits of $23.9 billion
partially offset by a decrease of $7.4 billion in retail certificates of
deposit attributable to runoff of maturing accounts. Growth in
average noninterest-bearing deposits, average money market
deposits and average interest-bearing demand deposits drove the
increase in transaction deposits, which resulted from deposits
added in the RBC Bank (USA) acquisition and organic growth.
Average total deposits represented 68% of average total assets for
2012 and 69% for 2011.
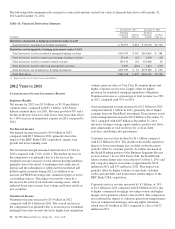
Total borrowed funds increased $4.2 billion from December 31,
2011 to $40.9 billion at December 31, 2012, due to increases in
Federal funds purchased and repurchase agreements, FHLB
borrowings and commercial paper net issuances, partially offset
by net repayments and maturities of bank notes and senior debt
and a reduction in subordinated debt due to redemptions of trust
preferred securities and hybrid capital securities.
Average borrowed funds increased to $41.8 billion for 2012
compared with $35.7 billion for 2011. An increase in
commercial paper and net issuances of FHLB borrowings
during 2012 drove the increase compared with 2011.
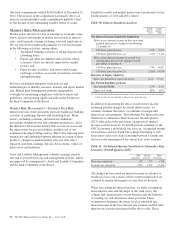
Shareholders’ Equity
Total shareholders’ equity increased $5.0 billion to $39.0
billion at December 31, 2012 compared with December 31,
2011 and included the impact of the following:
• An increase of $2.0 billion to retained earnings,
• The issuance of $2.0 billion of preferred stock during
2012, which contributed to the increase in capital
surplus – preferred stock to $3.6 billion at
December 31, 2012 compared to $1.6 billion at
December 31, 2011, and
• A $.9 billion increase in accumulated other
comprehensive income primarily due to higher net
unrealized gains on securities, partially offset by
lower unrealized gains on cash flow hedge
derivatives.
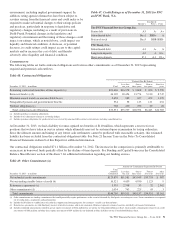
Risk-Based Capital
Regulatory capital ratios at December 31, 2012 were 9.6% for
Tier 1 common, 10.4% for leverage, 11.6% for Tier 1 risk-
based and 14.7% for total risk-based capital. At December 31,
2011, the regulatory capital ratios were 10.3% for Tier 1
common, 11.1% for leverage, 12.6% for Tier 1 risk-based and
15.8% for total risk-based capital. The decline in these ratios
was primarily due to the RBC Bank (USA) acquisition, which
resulted in higher goodwill and risk-weighted assets, partially
offset by retention of earnings which more than offset organic
asset growth. Our Tier 1 risk-based capital ratio reflected our
2012 capital actions of issuing approximately $2.0 billion of
preferred stock and redeeming approximately $2.3 billion of
trust preferred securities and hybrid capital securities.
G
LOSSARY
O
F
T
ERMS
Accretable net interest (Accretable yield) – The excess of cash
flows expected to be collected on a purchased impaired loan
over the carrying value of the loan. The accretable net interest
is recognized into interest income over the remaining life of
the loan using the constant effective yield method.
Adjusted average total assets – Primarily comprised of total
average quarterly (or annual) assets plus (less) unrealized
losses (gains) on investment securities, less goodwill and
certain other intangible assets (net of eligible deferred taxes).
Annualized – Adjusted to reflect a full year of activity.
Assets under management – Assets over which we have sole
or shared investment authority for our customers/clients. We
do not include these assets on our Consolidated Balance Sheet.
Basel I Tier 1 common capital – Basel I Tier 1 risk-based
capital, less preferred equity, less trust preferred capital
securities, and less noncontrolling interests.
Basel I Tier 1 common capital ratio – Basel I Tier 1 common
capital divided by period-end Basel I risk-weighted assets.
Basel I Leverage ratio – Basel I Tier 1 risk-based capital
divided by adjusted average total assets.
Basel I Tier 1 risk-based capital – Total shareholders’ equity,
plus trust preferred capital securities, plus certain
noncontrolling interests that are held by others, less goodwill
and certain other intangible assets (net of eligible deferred
taxes relating to taxable and nontaxable combinations), less
equity investments in nonfinancial companies, less ineligible
servicing assets, and less net unrealized holding losses on
available for sale equity securities. Net unrealized holding
gains on available for sale equity securities, net unrealized
holding gains (losses) on available for sale debt securities and
net unrealized holding gains (losses) on cash flow hedge
derivatives are excluded from total shareholders’ equity for
Basel I Tier 1 risk-based capital purposes.
Basel I Tier 1 risk-based capital ratio – Basel I Tier 1 risk-based
capital divided by period-end Basel I risk-weighted assets.
Basel I Total risk-based capital – Basel I Tier 1 risk-based capital
plus qualifying subordinated debt and trust preferred securities,
other noncontrolling interests not qualified as Basel I Tier 1,
eligible gains on available for sale equity securities and the
allowance for loan and lease losses, subject to certain limitations.
Basel I Total risk-based capital ratio – Basel I Total risk-based
capital divided by period-end Basel I risk-weighted assets.
The PNC Financial Services Group, Inc. – Form 10-K 99