PNC Bank 2013 Annual Report Download - page 149
Download and view the complete annual report
Please find page 149 of the 2013 PNC Bank annual report below. You can navigate through the pages in the report by either clicking on the pages listed below, or by using the keyword search tool below to find specific information within the annual report.-
 1
1 -
2
-
3
-
4
-
5
-
6
-
7
-
8
-
9
-
10
-
11
-
12
-
13
-
14
-
15
-
16
-
17
-
18
-
19
-
20
-
21
-
22
-
23
-
24
-
25
-
26
-
27
-
28
-
29
-
30
-
31
-
32
-
33
-
34
-
35
-
36
-
37
-
38
-
39
-
40
-
41
-
42
-
43
-
44
-
45
-
46
-
47
-
48
-
49
-
50
-
51
-
52
-
53
-
54
-
55
-
56
-
57
-
58
-
59
-
60
-
61
-
62
-
63
-
64
-
65
-
66
-
67
-
68
-
69
-
70
-
71
-
72
-
73
-
74
-
75
-
76
-
77
-
78
-
79
-
80
-
81
-
82
-
83
-
84
-
85
-
86
-
87
-
88
-
89
-
90
-
91
-
92
-
93
-
94
-
95
-
96
-
97
-
98
-
99
-
100
-
101
-
102
-
103
-
104
-
105
-
106
-
107
-
108
-
109
-
110
-
111
-
112
-
113
-
114
-
115
-
116
-
117
-
118
-
119
-
120
-
121
-
122
-
123
-
124
-
125
-
126
-
127
-
128
-
129
-
130
-
131
-
132
-
133
-
134
-
135
-
136
-
137
-
138
-
 139
139 -
 140
140 -
 141
141 -
 142
142 -
 143
143 -
 144
144 -
 145
145 -
 146
146 -
 147
147 -
 148
148 -
 149
149 -
 150
150 -
 151
151 -
 152
152 -
 153
153 -
 154
154 -
 155
155 -
 156
156 -
 157
157 -
 158
158 -
 159
159 -
160
-
161
-
162
-
163
-
164
-
165
-
166
-
167
-
168
-
169
-
170
-
171
-
172
-
173
-
174
-
175
-
176
-
177
-
178
-
179
-
180
-
181
-
182
-
183
-
184
-
185
-
186
-
187
-
188
-
189
-
190
-
191
-
192
-
193
-
194
-
195
-
196
-
197
-
198
-
199
-
200
-
201
-
202
-
203
-
204
-
205
-
206
-
207
-
208
-
209
-
210
-
211
-
212
-
213
-
214
-
215
-
216
-
217
-
218
-
219
-
220
-
221
-
222
-
223
-
224
-
225
-
226
-
227
-
228
-
229
-
230
-
231
-
232
-
233
-
234
-
235
-
236
-
237
-
238
-
239
-
240
-
241
-
242
-
243
-
244
-
245
-
246
-
247
-
248
-
249
-
250
-
251
-
252
-
253
-
254
-
255
-
256
-
257
-
258
-
259
-
260
-
261
-
262
-
263
-
264
-
265
-
266
 |
 |

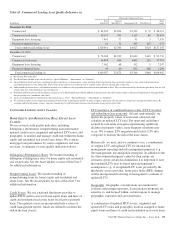
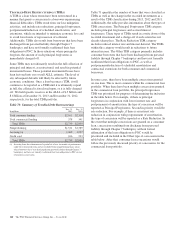
These products are standard in the financial services industry
and are considered during the underwriting process to mitigate
the increased risk that may result in borrowers not being able
to make interest and principal payments when due. We do not
believe that these product features create a concentration of
credit risk.
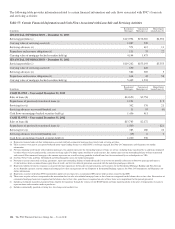
At December 31, 2013, we pledged $23.4 billion of
commercial loans to the Federal Reserve Bank (FRB) and
$40.4 billion of residential real estate and other loans to the
Federal Home Loan Bank (FHLB) as collateral for the
contingent ability to borrow, if necessary. The comparable
amounts at December 31, 2012 were $23.2 billion and $37.3
billion, respectively.
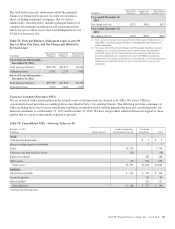
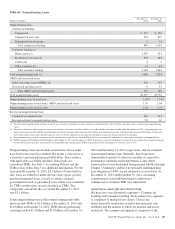
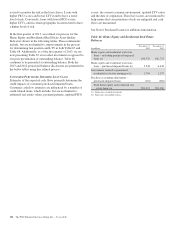
Table 62: Net Unfunded Credit Commitments
In millions
December 31
2013
December 31
2012
Total commercial lending $ 90,104 $ 78,703
Home equity lines of credit 18,754 19,814
Credit card 16,746 17,381
Other 4,266 4,694
Total (a) $129,870 $120,592
(a) Excludes standby letters of credit. See Note 24 Commitments and Guarantees for
additional information on standby letters of credit.
Commitments to extend credit represent arrangements to lend
funds or provide liquidity subject to specified contractual
conditions. At December 31, 2013, commercial commitments
reported above exclude $25.0 billion of syndications,
assignments and participations, primarily to financial
institutions. The comparable amount at December 31, 2012
was $22.5 billion.
Commitments generally have fixed expiration dates, may
require payment of a fee, and contain termination clauses in
the event the customer’s credit quality deteriorates. Based on
our historical experience, most commitments expire unfunded,
and therefore cash requirements are substantially less than the
total commitment.
N
OTE
5A
SSET
Q
UALITY
A
SSET
Q
UALITY
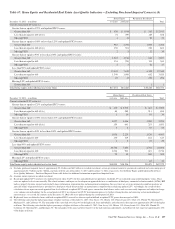
We closely monitor economic conditions and loan
performance trends to manage and evaluate our exposure to
credit risk. Trends in delinquency rates may be a key
indicator, among other considerations, of credit risk within the
loan portfolios. The measurement of delinquency status is
based on the contractual terms of each loan. Loans that are 30
days or more past due in terms of payment are considered
delinquent. Loan delinquencies exclude loans held for sale,
purchased impaired loans and nonperforming loans, but
include government insured or guaranteed loans and loans
accounted for under the fair value option.
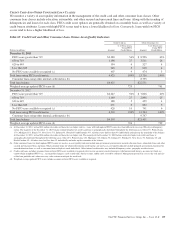
The trends in nonperforming assets represent another key
indicator of the potential for future credit losses.
Nonperforming assets include nonperforming loans, OREO
and foreclosed assets. Nonperforming loans are those loans
accounted for at amortized cost that have deteriorated in credit
quality to the extent that full collection of contractual principal
and interest is not probable. Interest income is not recognized
on these loans. Loans accounted for under the fair value
option are reported as performing loans as these loans are
accounted for at fair value. However, when nonaccrual criteria
is met, interest income is not recognized on these loans.
Additionally, certain government insured or guaranteed loans
for which we expect to collect substantially all principal and
interest are not reported as nonperforming loans and continue
to accrue interest. Purchased impaired loans are excluded from
nonperforming loans as we are currently accreting interest
income over the expected life of the loans. See Note 6
Purchased Loans for further information.
See Note 1 Accounting Policies for additional delinquency,
nonperforming, and charge-off information.
The PNC Financial Services Group, Inc. – Form 10-K 131