PNC Bank 2013 Annual Report Download - page 178
Download and view the complete annual report
Please find page 178 of the 2013 PNC Bank annual report below. You can navigate through the pages in the report by either clicking on the pages listed below, or by using the keyword search tool below to find specific information within the annual report.-
 1
1 -
2
-
3
-
4
-
5
-
6
-
7
-
8
-
9
-
10
-
11
-
12
-
13
-
14
-
15
-
16
-
17
-
18
-
19
-
20
-
21
-
22
-
23
-
24
-
25
-
26
-
27
-
28
-
29
-
30
-
31
-
32
-
33
-
34
-
35
-
36
-
37
-
38
-
39
-
40
-
41
-
42
-
43
-
44
-
45
-
46
-
47
-
48
-
49
-
50
-
51
-
52
-
53
-
54
-
55
-
56
-
57
-
58
-
59
-
60
-
61
-
62
-
63
-
64
-
65
-
66
-
67
-
68
-
69
-
70
-
71
-
72
-
73
-
74
-
75
-
76
-
77
-
78
-
79
-
80
-
81
-
82
-
83
-
84
-
85
-
86
-
87
-
88
-
89
-
90
-
91
-
92
-
93
-
94
-
95
-
96
-
97
-
98
-
99
-
100
-
101
-
102
-
103
-
104
-
105
-
106
-
107
-
108
-
109
-
110
-
111
-
112
-
113
-
114
-
115
-
116
-
117
-
118
-
119
-
120
-
121
-
122
-
123
-
124
-
125
-
126
-
127
-
128
-
129
-
130
-
131
-
132
-
133
-
134
-
135
-
136
-
137
-
138
-
139
-
140
-
141
-
142
-
143
-
144
-
145
-
146
-
147
-
148
-
149
-
150
-
151
-
152
-
153
-
154
-
155
-
156
-
157
-
158
-
159
-
160
-
161
-
162
-
163
-
164
-
165
-
166
-
167
-
 168
168 -
 169
169 -
 170
170 -
 171
171 -
 172
172 -
 173
173 -
 174
174 -
 175
175 -
 176
176 -
 177
177 -
 178
178 -
 179
179 -
 180
180 -
 181
181 -
 182
182 -
 183
183 -
 184
184 -
 185
185 -
 186
186 -
 187
187 -
 188
188 -
189
-
190
-
191
-
192
-
193
-
194
-
195
-
196
-
197
-
198
-
199
-
200
-
201
-
202
-
203
-
204
-
205
-
206
-
207
-
208
-
209
-
210
-
211
-
212
-
213
-
214
-
215
-
216
-
217
-
218
-
219
-
220
-
221
-
222
-
223
-
224
-
225
-
226
-
227
-
228
-
229
-
230
-
231
-
232
-
233
-
234
-
235
-
236
-
237
-
238
-
239
-
240
-
241
-
242
-
243
-
244
-
245
-
246
-
247
-
248
-
249
-
250
-
251
-
252
-
253
-
254
-
255
-
256
-
257
-
258
-
259
-
260
-
261
-
262
-
263
-
264
-
265
-
266
 |
 |

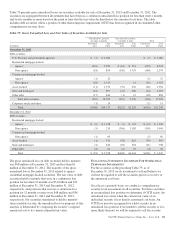
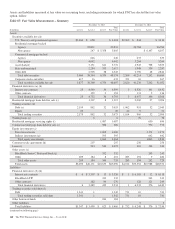
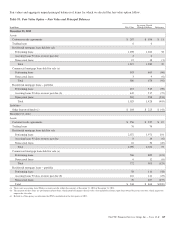
Assets and liabilities measured at fair value on a recurring basis, including instruments for which PNC has elected the fair value
option, follow.
Table 87: Fair Value Measurements – Summary
December 31, 2013 December 31, 2012
In millions Level 1 Level 2 Level 3
Total
Fair Value Level 1 Level 2 Level 3
Total
Fair Value
Assets
Securities available for sale
U.S. Treasury and government agencies $3,460 $ 658 $ 4,118 $2,269 $ 844 $ 3,113
Residential mortgage-backed
Agency 22,831 22,831 26,784 26,784
Non-agency 247 $ 5,358 5,605 $ 6,107 6,107
Commercial mortgage-backed
Agency 646 646 633 633
Non-agency 4,042 4,042 3,264 3,264
Asset-backed 5,131 641 5,772 4,945 708 5,653
State and municipal 2,284 333 2,617 1,948 339 2,287
Other debt 2,505 38 2,543 2,796 48 2,844
Total debt securities 3,460 38,344 6,370 48,174 2,269 41,214 7,202 50,685
Corporate stocks and other 417 16 433 351 16 367
Total securities available for sale 3,877 38,360 6,370 48,607 2,620 41,230 7,202 51,052
Financial derivatives (a) (b)
Interest rate contracts 25 4,540 34 4,599 5 8,326 101 8,432
Other contracts 192 2 194 131 5 136
Total financial derivatives 25 4,732 36 4,793 5 8,457 106 8,568
Residential mortgage loans held for sale (c) 1,307 8 1,315 2,069 27 2,096
Trading securities (d)
Debt (e) 2,159 862 32 3,053 1,062 951 32 2,045
Equity 20 20 42 9 51
Total trading securities 2,179 862 32 3,073 1,104 960 32 2,096
Trading loans (a) 6 6 76 76
Residential mortgage servicing rights (f) 1,087 1,087 650 650
Commercial mortgage loans held for sale (c) 586 586 772 772
Equity investments (a)
Direct investments 1,069 1,069 1,171 1,171
Indirect investments (g) 595 595 642 642
Total equity investments 1,664 1,664 1,813 1,813
Customer resale agreements (h) 207 207 256 256
Loans (i) 513 512 1,025 110 134 244
Other assets (a)
BlackRock Series C Preferred Stock (j) 332 332 243 243
Other 209 184 8 401 283 194 9 486
Total other assets 209 184 340 733 283 194 252 729
Total assets $6,290 $46,171 $10,635 $63,096 $4,012 $53,352 $10,988 $68,352
Liabilities
Financial derivatives (b) (k)
Interest rate contracts $ 6 $ 3,307 $ 13 $ 3,326 $ 1 $ 6,105 $ 12 $ 6,118
BlackRock LTIP 332 332 243 243
Other contracts 182 94 276 128 121 249
Total financial derivatives 6 3,489 439 3,934 1 6,233 376 6,610
Trading securities sold short (l)
Debt 1,341 1 1,342 731 10 741
Total trading securities sold short 1,341 1 1,342 731 10 741
Other borrowed funds 184 184
Other liabilities 55
Total liabilities $1,347 $ 3,490 $ 623 $ 5,460 $ 732 $ 6,248 $ 376 $ 7,356
(continued on following page)
160 The PNC Financial Services Group, Inc. – Form 10-K