PNC Bank 2013 Annual Report Download - page 55
Download and view the complete annual report
Please find page 55 of the 2013 PNC Bank annual report below. You can navigate through the pages in the report by either clicking on the pages listed below, or by using the keyword search tool below to find specific information within the annual report.-
 1
1 -
2
-
3
-
4
-
5
-
6
-
7
-
8
-
9
-
10
-
11
-
12
-
13
-
14
-
15
-
16
-
17
-
18
-
19
-
20
-
21
-
22
-
23
-
24
-
25
-
26
-
27
-
28
-
29
-
30
-
31
-
32
-
33
-
34
-
35
-
36
-
37
-
38
-
39
-
40
-
41
-
42
-
43
-
44
-
 45
45 -
 46
46 -
 47
47 -
 48
48 -
 49
49 -
 50
50 -
 51
51 -
 52
52 -
 53
53 -
 54
54 -
 55
55 -
 56
56 -
 57
57 -
 58
58 -
 59
59 -
 60
60 -
 61
61 -
 62
62 -
 63
63 -
 64
64 -
 65
65 -
66
-
67
-
68
-
69
-
70
-
71
-
72
-
73
-
74
-
75
-
76
-
77
-
78
-
79
-
80
-
81
-
82
-
83
-
84
-
85
-
86
-
87
-
88
-
89
-
90
-
91
-
92
-
93
-
94
-
95
-
96
-
97
-
98
-
99
-
100
-
101
-
102
-
103
-
104
-
105
-
106
-
107
-
108
-
109
-
110
-
111
-
112
-
113
-
114
-
115
-
116
-
117
-
118
-
119
-
120
-
121
-
122
-
123
-
124
-
125
-
126
-
127
-
128
-
129
-
130
-
131
-
132
-
133
-
134
-
135
-
136
-
137
-
138
-
139
-
140
-
141
-
142
-
143
-
144
-
145
-
146
-
147
-
148
-
149
-
150
-
151
-
152
-
153
-
154
-
155
-
156
-
157
-
158
-
159
-
160
-
161
-
162
-
163
-
164
-
165
-
166
-
167
-
168
-
169
-
170
-
171
-
172
-
173
-
174
-
175
-
176
-
177
-
178
-
179
-
180
-
181
-
182
-
183
-
184
-
185
-
186
-
187
-
188
-
189
-
190
-
191
-
192
-
193
-
194
-
195
-
196
-
197
-
198
-
199
-
200
-
201
-
202
-
203
-
204
-
205
-
206
-
207
-
208
-
209
-
210
-
211
-
212
-
213
-
214
-
215
-
216
-
217
-
218
-
219
-
220
-
221
-
222
-
223
-
224
-
225
-
226
-
227
-
228
-
229
-
230
-
231
-
232
-
233
-
234
-
235
-
236
-
237
-
238
-
239
-
240
-
241
-
242
-
243
-
244
-
245
-
246
-
247
-
248
-
249
-
250
-
251
-
252
-
253
-
254
-
255
-
256
-
257
-
258
-
259
-
260
-
261
-
262
-
263
-
264
-
265
-
266
 |
 |
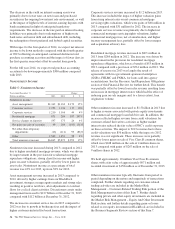
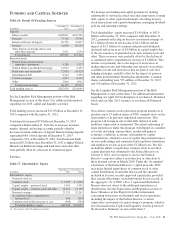
In the first quarter of 2014, we expect fee income to be lower
compared with the fourth quarter of 2013 due to the fourth
quarter benefit from the release of reserves for residential
mortgage repurchase obligations as well as some seasonal
impact on the comparison.
For full year 2014, we expect total revenue to continue to be
under pressure and likely to be down compared to 2013 due to
an expected $300 million decline in purchase accounting
accretion as well as lower expected residential mortgage
revenue, partially offset by the impact of our ability to grow
loans and sustain growth in our fee-based businesses.
P
ROVISION
F
OR
C
REDIT
L
OSSES
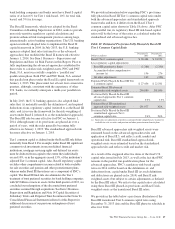
The provision for credit losses totaled $643 million in 2013
compared with $987 million in 2012. The decrease in
provision compared to prior year was the result of continued
credit quality improvement, including improvement in our
purchased impaired loan portfolio. Increasing value of
residential real estate is among the factors contributing to
improved credit quality.
We currently expect our provision for credit losses in the first
quarter of 2014 to be between $125 million and $200 million,
assuming credit quality improvements continue.
The Credit Risk Management portion of the Risk Management
section of this Item 7 includes additional information
regarding factors impacting the provision for credit losses.
N
ONINTEREST
E
XPENSE
Noninterest expense was $9.8 billion for 2013, a decrease of
$.8 billion, or 7%, from $10.6 billion for 2012. The decline
reflected the impact of 2012 integration costs of $267 million
and a reduction in noncash charges related to redemption of
trust preferred securities to $57 million in 2013 from $295
million in 2012. Additionally, residential mortgage
foreclosure-related expenses declined to $56 million from
$225 million in the same comparison. These decreases to
noninterest expense were partially offset by the impact of a
full year of operating expense for the March 2012 RBC Bank
(USA) acquisition during 2013 compared to 2012.
In the third quarter of 2013, we concluded redemptions of
discounted trust preferred securities assumed in our
acquisitions. Since the fourth quarter of 2011, we have
redeemed a total of $3.2 billion of these higher-rate trust
preferred securities, resulting in noncash charges totaling
approximately $550 million.
Reflecting our continued focus on disciplined expense
management, we exceeded our 2013 continuous improvement
cost savings goal of $700 million with cost savings of more
than $775 million during 2013. We plan to sustain these
efforts in 2014 and have a continuous improvement savings
goal of $500 million. Similar to 2013, we expect to offset
these savings in 2014 with investments in our infrastructure
and diversified businesses, including our Retail Banking
transformation, consistent with our strategic priorities.
For the first quarter of 2014, we expect noninterest expense to
be down by mid-single digits on a percentage basis compared
with the fourth quarter of 2013, and for full year 2014, we
expect noninterest expense to be lower compared with 2013,
in each case apart from the impact of potential legal and
regulatory contingencies. In the first quarter of 2014, we
intend to early adopt new accounting guidance regarding low
income housing tax credits. As a result, noninterest expense
on certain tax credit investments will be reclassified to income
tax expense. Due to retrospective application of the
accounting change, this reclassification is not expected to have
an impact on our expense guidance for the year.
E
FFECTIVE
I
NCOME
T
AX
R
ATE
The effective income tax rate was 24.1% for 2013 compared
with 23.9% for 2012.
The effective tax rate is generally lower than the statutory rate
primarily due to tax credits PNC receives from our
investments in low income housing and new markets
investments, as well as earnings in other tax exempt
investments.
The PNC Financial Services Group, Inc. – Form 10-K 37