PNC Bank 2013 Annual Report Download - page 171
Download and view the complete annual report
Please find page 171 of the 2013 PNC Bank annual report below. You can navigate through the pages in the report by either clicking on the pages listed below, or by using the keyword search tool below to find specific information within the annual report.-
 1
1 -
2
-
3
-
4
-
5
-
6
-
7
-
8
-
9
-
10
-
11
-
12
-
13
-
14
-
15
-
16
-
17
-
18
-
19
-
20
-
21
-
22
-
23
-
24
-
25
-
26
-
27
-
28
-
29
-
30
-
31
-
32
-
33
-
34
-
35
-
36
-
37
-
38
-
39
-
40
-
41
-
42
-
43
-
44
-
45
-
46
-
47
-
48
-
49
-
50
-
51
-
52
-
53
-
54
-
55
-
56
-
57
-
58
-
59
-
60
-
61
-
62
-
63
-
64
-
65
-
66
-
67
-
68
-
69
-
70
-
71
-
72
-
73
-
74
-
75
-
76
-
77
-
78
-
79
-
80
-
81
-
82
-
83
-
84
-
85
-
86
-
87
-
88
-
89
-
90
-
91
-
92
-
93
-
94
-
95
-
96
-
97
-
98
-
99
-
100
-
101
-
102
-
103
-
104
-
105
-
106
-
107
-
108
-
109
-
110
-
111
-
112
-
113
-
114
-
115
-
116
-
117
-
118
-
119
-
120
-
121
-
122
-
123
-
124
-
125
-
126
-
127
-
128
-
129
-
130
-
131
-
132
-
133
-
134
-
135
-
136
-
137
-
138
-
139
-
140
-
141
-
142
-
143
-
144
-
145
-
146
-
147
-
148
-
149
-
150
-
151
-
152
-
153
-
154
-
155
-
156
-
157
-
158
-
159
-
160
-
 161
161 -
 162
162 -
 163
163 -
 164
164 -
 165
165 -
 166
166 -
 167
167 -
 168
168 -
 169
169 -
 170
170 -
 171
171 -
 172
172 -
 173
173 -
 174
174 -
 175
175 -
 176
176 -
 177
177 -
 178
178 -
 179
179 -
 180
180 -
 181
181 -
182
-
183
-
184
-
185
-
186
-
187
-
188
-
189
-
190
-
191
-
192
-
193
-
194
-
195
-
196
-
197
-
198
-
199
-
200
-
201
-
202
-
203
-
204
-
205
-
206
-
207
-
208
-
209
-
210
-
211
-
212
-
213
-
214
-
215
-
216
-
217
-
218
-
219
-
220
-
221
-
222
-
223
-
224
-
225
-
226
-
227
-
228
-
229
-
230
-
231
-
232
-
233
-
234
-
235
-
236
-
237
-
238
-
239
-
240
-
241
-
242
-
243
-
244
-
245
-
246
-
247
-
248
-
249
-
250
-
251
-
252
-
253
-
254
-
255
-
256
-
257
-
258
-
259
-
260
-
261
-
262
-
263
-
264
-
265
-
266
 |
 |

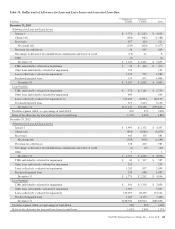
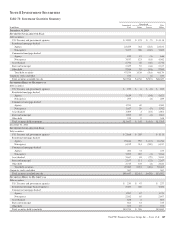
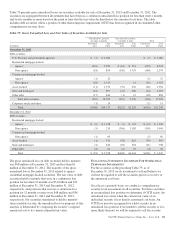
The following table presents a rollforward of the cumulative OTTI credit losses recognized in earnings for all debt securities for
which a portion of an OTTI loss was recognized in Accumulated other comprehensive income (loss).
Table 82: Rollforward of Cumulative OTTI Credit Losses Recognized in Earnings
Year ended December 31
In millions 2013 2012
Balance at beginning of period $(1,201) $(1,091)
Loss where impairment was not previously recognized (10)
Additional loss where credit impairment was previously recognized (16) (101)
Reduction due to credit impaired securities sold or matured 57 1
Balance at end of period $(1,160) $(1,201)
Information relating to gross realized securities gains and losses from the sales of securities is set forth in the following table.
Table 83: Gains (Losses) on Sales of Securities Available for Sale
In millions Proceeds
Gross
Gains
Gross
Losses
Net
Gains
Tax
Expense
For the year ended December 31
2013 $ 8,178 $146 $ (47) $ 99 $35
2012 9,441 214 (10) 204 71
2011 21,039 406 (157) 249 87
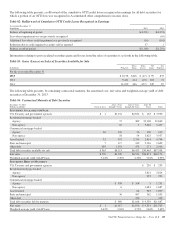
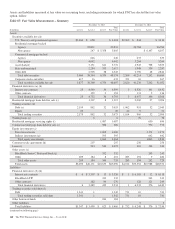
The following table presents, by remaining contractual maturity, the amortized cost, fair value and weighted-average yield of debt
securities at December 31, 2013.
Table 84: Contractual Maturity of Debt Securities
December 31, 2013
Dollars in millions 1 Year or Less
After 1 Year
through 5 Years
After 5 Years
through 10 Years
After 10
Years Total
S
ECURITIES
A
VAILABLE FOR
S
ALE
U.S. Treasury and government agencies $ 1 $1,152 $2,674 $ 163 $ 3,990
Residential mortgage-backed
Agency 72 489 22,108 22,669
Non-agency 10 1 5,446 5,457
Commercial mortgage-backed
Agency 66 430 36 100 632
Non-agency 58 54 3,825 3,937
Asset-backed 32 973 2,335 2,414 5,754
State and municipal 7 117 349 2,136 2,609
Other debt 459 1,301 475 271 2,506
Total debt securities available for sale $ 565 $4,113 $6,413 $36,463 $47,554
Fair value $ 570 $4,209 $6,524 $36,871 $48,174
Weighted-average yield, GAAP basis 3.01% 2.49% 2.36% 3.16% 2.99%
S
ECURITIES
H
ELD TO
M
ATURITY
U.S. Treasury and government agencies $ 239 $ 239
Residential mortgage-backed
Agency 5,814 5,814
Non-agency 293 293
Commercial mortgage-backed
Agency $ 938 $ 308 5 1,251
Non-agency 6 1,681 1,687
Asset-backed 64 945 1,009
State and municipal 36 457 562 1,055
Other debt 339 339
Total debt securities held to maturity $ 980 $1,168 $ 9,539 $11,687
Fair value $ 1 $1,017 $1,196 $ 9,551 $11,765
Weighted-average yield, GAAP basis 2.42% 3.24% 3.73% 3.64% 3.62%
The PNC Financial Services Group, Inc. – Form 10-K 153