PNC Bank 2013 Annual Report Download - page 61
Download and view the complete annual report
Please find page 61 of the 2013 PNC Bank annual report below. You can navigate through the pages in the report by either clicking on the pages listed below, or by using the keyword search tool below to find specific information within the annual report.-
 1
1 -
2
-
3
-
4
-
5
-
6
-
7
-
8
-
9
-
10
-
11
-
12
-
13
-
14
-
15
-
16
-
17
-
18
-
19
-
20
-
21
-
22
-
23
-
24
-
25
-
26
-
27
-
28
-
29
-
30
-
31
-
32
-
33
-
34
-
35
-
36
-
37
-
38
-
39
-
40
-
41
-
42
-
43
-
44
-
45
-
46
-
47
-
48
-
49
-
50
-
 51
51 -
 52
52 -
 53
53 -
 54
54 -
 55
55 -
 56
56 -
 57
57 -
 58
58 -
 59
59 -
 60
60 -
 61
61 -
 62
62 -
 63
63 -
 64
64 -
 65
65 -
 66
66 -
 67
67 -
 68
68 -
 69
69 -
 70
70 -
 71
71 -
72
-
73
-
74
-
75
-
76
-
77
-
78
-
79
-
80
-
81
-
82
-
83
-
84
-
85
-
86
-
87
-
88
-
89
-
90
-
91
-
92
-
93
-
94
-
95
-
96
-
97
-
98
-
99
-
100
-
101
-
102
-
103
-
104
-
105
-
106
-
107
-
108
-
109
-
110
-
111
-
112
-
113
-
114
-
115
-
116
-
117
-
118
-
119
-
120
-
121
-
122
-
123
-
124
-
125
-
126
-
127
-
128
-
129
-
130
-
131
-
132
-
133
-
134
-
135
-
136
-
137
-
138
-
139
-
140
-
141
-
142
-
143
-
144
-
145
-
146
-
147
-
148
-
149
-
150
-
151
-
152
-
153
-
154
-
155
-
156
-
157
-
158
-
159
-
160
-
161
-
162
-
163
-
164
-
165
-
166
-
167
-
168
-
169
-
170
-
171
-
172
-
173
-
174
-
175
-
176
-
177
-
178
-
179
-
180
-
181
-
182
-
183
-
184
-
185
-
186
-
187
-
188
-
189
-
190
-
191
-
192
-
193
-
194
-
195
-
196
-
197
-
198
-
199
-
200
-
201
-
202
-
203
-
204
-
205
-
206
-
207
-
208
-
209
-
210
-
211
-
212
-
213
-
214
-
215
-
216
-
217
-
218
-
219
-
220
-
221
-
222
-
223
-
224
-
225
-
226
-
227
-
228
-
229
-
230
-
231
-
232
-
233
-
234
-
235
-
236
-
237
-
238
-
239
-
240
-
241
-
242
-
243
-
244
-
245
-
246
-
247
-
248
-
249
-
250
-
251
-
252
-
253
-
254
-
255
-
256
-
257
-
258
-
259
-
260
-
261
-
262
-
263
-
264
-
265
-
266
 |
 |

I
NVESTMENT
S
ECURITIES
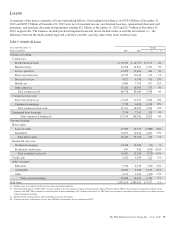
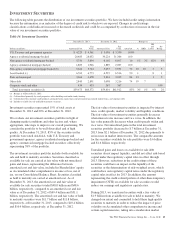
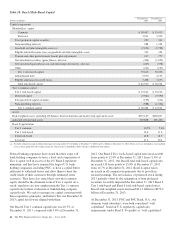
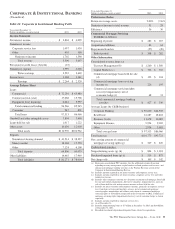
The following table presents the distribution of our investment securities portfolio. We have included credit ratings information
because the information is an indicator of the degree of credit risk to which we are exposed. Changes in credit ratings
classifications could indicate increased or decreased credit risk and could be accompanied by a reduction or increase in the fair
value of our investment securities portfolio.
Table 14: Investment Securities
December 31, 2013 December 31, 2012 Ratings (a)
Dollars in millions Amortized Cost
Fair
Value Amortized Cost
Fair
Value AAA/AA A BBB
BB
and
Lower
No
Rating
U.S. Treasury and government agencies $ 4,229 $ 4,361 $ 3,098 $ 3,390 100%
Agency residential mortgage-backed 28,483 28,652 30,224 31,366 100
Non-agency residential mortgage-backed 5,750 5,894 6,102 6,107 10 1% 3% 82% 4%
Agency commercial mortgage-backed 1,883 1,946 1,889 2,007 100
Non-agency commercial mortgage-backed (b) 5,624 5,744 5,637 5,931 72 10 10 3 5
Asset-backed (c) 6,763 6,773 6,525 6,516 90 1 8 1
State and municipal 3,664 3,678 2,861 3,012 84 13 1 2
Other debt 2,845 2,891 3,098 3,216 74 19 7
Corporate stock and other 434 433 367 367 100
Total investment securities (d) $59,675 $60,372 $59,801 $61,912 85% 3% 1% 9% 2%
(a) Ratings as of December 31, 2013.
(b) Collateralized primarily by retail properties, office buildings and multi-family housing.
(c) Collateralized by consumer credit products, primarily home equity loans and government guaranteed student loans, and corporate debt.
(d) Includes available for sale and held to maturity securities.
Investment securities represented 19% of total assets at
December 31, 2013 and 20% at December 31, 2012.
We evaluate our investment securities portfolio in light of
changing market conditions and other factors and, where
appropriate, take steps to improve our overall positioning. We
consider the portfolio to be well-diversified and of high
quality. At December 31, 2013, 85% of the securities in the
portfolio were rated AAA/AA, with U.S. Treasury and
government agencies, agency residential mortgage-backed and
agency commercial mortgage-backed securities collectively
representing 58% of the portfolio.
The investment securities portfolio includes both available for
sale and held to maturity securities. Securities classified as
available for sale are carried at fair value with net unrealized
gains and losses, representing the difference between
amortized cost and fair value, included in Shareholders’ equity
as Accumulated other comprehensive income or loss, net of
tax, on our Consolidated Balance Sheet. Securities classified
as held to maturity are carried at amortized cost. As of
December 31, 2013, the amortized cost and fair value of
available for sale securities totaled $48.0 billion and $48.6
billion, respectively, compared to an amortized cost and fair
value as of December 31, 2012 of $49.4 billion and $51.1
billion, respectively. The amortized cost and fair value of held
to maturity securities were $11.7 billion and $11.8 billion,
respectively, at December 31, 2013, compared to $10.4 billion
and $10.9 billion, respectively, at December 31, 2012.
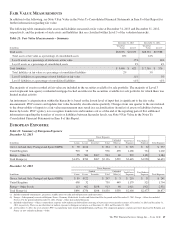
The fair value of investment securities is impacted by interest
rates, credit spreads, market volatility and liquidity conditions.
The fair value of investment securities generally decreases
when interest rates increase and vice versa. In addition, the
fair value generally decreases when credit spreads widen and
vice versa. Net unrealized gains in the total investment
securities portfolio decreased to $.7 billion at December 31,
2013 from $2.1 billion at December 31, 2012 due primarily to
an increase in market interest rates. The comparable amounts
for the securities available for sale portfolio were $.6 billion
and $1.6 billion, respectively.
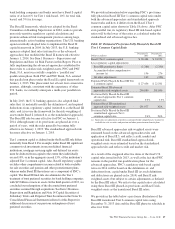
Unrealized gains and losses on available for sale debt
securities do not impact liquidity, and did not affect risk-based
capital under the regulatory capital rules in effect through
2013. However, reductions in the credit ratings of these
securities could have an impact on the liquidity of the
securities or the determination of risk-weighted assets, which
could reduce our regulatory capital ratios under the regulatory
capital rules in effect for 2013. In addition, the amount
representing the credit-related portion of other-than-temporary
impairment (OTTI) on available for sale securities would
reduce our earnings and regulatory capital ratios.
During 2013, we transferred securities with a fair value of
$1.9 billion from available for sale to held to maturity. We
changed our intent and committed to hold these high-quality
securities to maturity in order to reduce the impact of price
volatility on Accumulated other comprehensive income and
certain capital measures, taking into consideration market
The PNC Financial Services Group, Inc. – Form 10-K 43