Reebok 2013 Annual Report Download - page 74
Download and view the complete annual report
Please find page 74 of the 2013 Reebok annual report below. You can navigate through the pages in the report by either clicking on the pages listed below, or by using the keyword search tool below to find specific information within the annual report.-
 1
1 -
2
-
3
-
4
-
5
-
6
-
7
-
8
-
9
-
10
-
11
-
12
-
13
-
14
-
15
-
16
-
17
-
18
-
19
-
20
-
21
-
22
-
23
-
24
-
25
-
26
-
27
-
28
-
29
-
30
-
31
-
32
-
33
-
34
-
35
-
36
-
37
-
38
-
39
-
40
-
41
-
42
-
43
-
44
-
45
-
46
-
47
-
48
-
49
-
50
-
51
-
52
-
53
-
54
-
55
-
56
-
57
-
58
-
59
-
60
-
61
-
62
-
63
-
 64
64 -
 65
65 -
 66
66 -
 67
67 -
 68
68 -
 69
69 -
 70
70 -
 71
71 -
 72
72 -
 73
73 -
 74
74 -
 75
75 -
 76
76 -
 77
77 -
 78
78 -
 79
79 -
 80
80 -
 81
81 -
 82
82 -
 83
83 -
 84
84 -
85
-
86
-
87
-
88
-
89
-
90
-
91
-
92
-
93
-
94
-
95
-
96
-
97
-
98
-
99
-
100
-
101
-
102
-
103
-
104
-
105
-
106
-
107
-
108
-
109
-
110
-
111
-
112
-
113
-
114
-
115
-
116
-
117
-
118
-
119
-
120
-
121
-
122
-
123
-
124
-
125
-
126
-
127
-
128
-
129
-
130
-
131
-
132
-
133
-
134
-
135
-
136
-
137
-
138
-
139
-
140
-
141
-
142
-
143
-
144
-
145
-
146
-
147
-
148
-
149
-
150
-
151
-
152
-
153
-
154
-
155
-
156
-
157
-
158
-
159
-
160
-
161
-
162
-
163
-
164
-
165
-
166
-
167
-
168
-
169
-
170
-
171
-
172
-
173
-
174
-
175
-
176
-
177
-
178
-
179
-
180
-
181
-
182
-
183
-
184
-
185
-
186
-
187
-
188
-
189
-
190
-
191
-
192
-
193
-
194
-
195
-
196
-
197
-
198
-
199
-
200
-
201
-
202
-
203
-
204
-
205
-
206
-
207
-
208
-
209
-
210
-
211
-
212
-
213
-
214
-
215
-
216
-
217
-
218
-
219
-
220
-
221
-
222
-
223
-
224
-
225
-
226
-
227
-
228
-
229
-
230
-
231
-
232
-
233
-
234
-
235
-
236
-
237
-
238
-
239
-
240
-
241
-
242
-
243
-
244
-
245
-
246
-
247
-
248
-
249
-
250
-
251
-
252
-
253
-
254
-
255
-
256
-
257
-
258
-
259
-
260
-
261
-
262
-
263
-
264
 |
 |
adidas Group
/
2013 Annual Report
Group Management Report – Our Group
70
2013
Group Strategy
/
02.3
/
adidas Group Route 2015 strategic goals
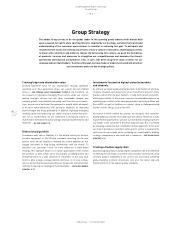
In November 2010, the Group unveiled its 2015 strategic business
plan named “Route 2015”, which defines strategies and objectives for
the period up to 2015. This plan is the most comprehensive the adidas
Group has ever developed, incorporating all brands, sales channels
and Group functions globally. Based on our strong brands, premium
products, extensive global presence and commitment to innovation and
the consumer, we aspire to grow our business significantly until 2015.
According to our plan, total Group sales are targeted to grow 45% to
50% on a currency-neutral basis over the five-year period, thereby
outperforming total market growth (both GDP and sporting goods
industry). In addition, we aim to grow our bottom line faster than the top
line. It is targeted to grow annual earnings at a compound annual growth
rate of 15% and to reach an operating margin of 11%.
In December 2013, although acknowledging that the achievement of our
goals will be more challenging than originally anticipated, Management
confirmed its Route 2015 aspirations for the Group
/
TABLE 02. However,
given further headwinds from the weakening of several currencies
versus the euro since the beginning of 2014, we believe there is now
an even higher risk to the achievement of our 2015 aspirations
/
SEE
SUBSEQUENT EVENTS AND OUTLOOK, P. 151
/
SEE MANAGEMENT ASSESSMENT OF
PERFORM ANCE, RISKS AND OPPORTUNITIES, AND OUTLOOK, P. 180.
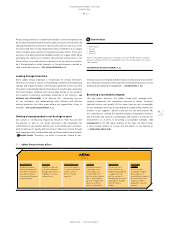
In order to reach our Route 2015 strategic goals, we have defined clear
strategic priorities. These include:
/
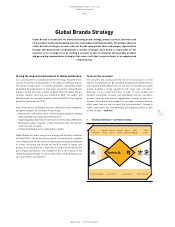
Clear brand positioning and prioritisation: We believe that we have
significant growth potential to exploit from our portfolio of brands. The
majority of our targeted growth will come from Global Brands, which
we anticipate will contribute over 80% of the Group’s expected revenue
increase over the period
/
SEE GLOBAL BRANDS STRATEGY, P. 77. Areas
within the adidas and Reebok brands that have been identified as key
contributors to sustainable growth for the adidas Group include:
/
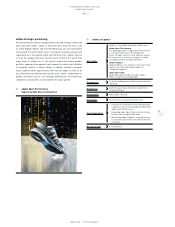
adidas Sport Performance: gaining sales and market share in the
running and basketball categories.
/
adidas Originals & Sport Style: expanding in the fast-fashion business
with the adidas NEO label and maintaining the strong momentum of
adidas Originals.
/
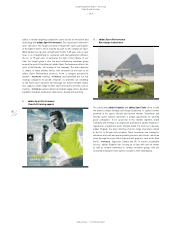
Reebok: establishing Reebok as the leading fitness brand.
/
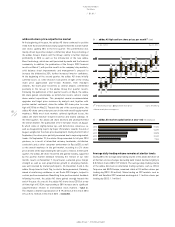
Expand presence in key growth markets: We have identified North
America, Greater China, Russia/CIS, Latin America, Japan and the UK
as key growth markets. Of those markets, the three ”attack markets”
North America, Greater China and Russia/CIS are expected to contribute
around 50% of the total Group growth under the Route 2015 plan,
with each market targeting a double-digit compound annual growth
rate
/
SEE GLOBAL SALES STRATEGY, P. 72. In the USA, the Group’s brands
have enormous potential to gain market share by focusing on improved
distribution and allowing a higher share of products to be specifically
designed for that market. In emerging markets such as China and
Russia/CIS, rising standards of living, increasing disposable income,
positive demographic trends and growing sports participation should
support demand for sporting goods.
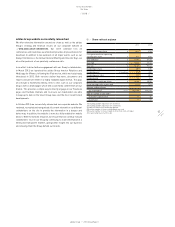
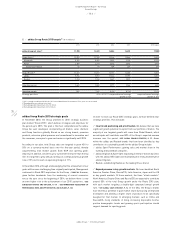
02
/
adidas Group Route 2015 targets 1) (€ in millions)
2010 2011 2012 2013 2015 targets
adidas Group net sales 2) 11,990 13,322 14,883 14,492 17,000
Global Sales 2) 10,570 11,742 12,906 12,546 14,800
Wholesale 8,181 8,949 9,533 9,100 10,200
Retail 2,389 2,793 3,373 3,446 4,600
thereof eCommerce 55 89 158 250 500
Global Brands 2) 10,627 11,807 13,011 12,658 14,800
adidas 8,714 9,867 11,344 11,059 12,800
Reebok 1,913 1,940 1,667 1,599 2,000
Other Businesses 1,420 1,580 1,977 1,946 2,200
Operating margin 7.5% 7.2% 8.0% 3) 8.7% 4) 11.0%
Earnings per share 2010 – 2013 3) 4): compound annual earnings
growth of 14%
compound annual earnings
growth of 15%
1) 2011 restated according to IAS 8 in the 2012 consolidated financial statements. Prior years are not restated.
2) Rounding differences may arise in totals.
3) Excluding goodwill impairment of € 265 million.
4) Excluding goodwill impairmant of € 52 million.