Reebok 2013 Annual Report Download - page 210
Download and view the complete annual report
Please find page 210 of the 2013 Reebok annual report below. You can navigate through the pages in the report by either clicking on the pages listed below, or by using the keyword search tool below to find specific information within the annual report.-
 1
1 -
2
-
3
-
4
-
5
-
6
-
7
-
8
-
9
-
10
-
11
-
12
-
13
-
14
-
15
-
16
-
17
-
18
-
19
-
20
-
21
-
22
-
23
-
24
-
25
-
26
-
27
-
28
-
29
-
30
-
31
-
32
-
33
-
34
-
35
-
36
-
37
-
38
-
39
-
40
-
41
-
42
-
43
-
44
-
45
-
46
-
47
-
48
-
49
-
50
-
51
-
52
-
53
-
54
-
55
-
56
-
57
-
58
-
59
-
60
-
61
-
62
-
63
-
64
-
65
-
66
-
67
-
68
-
69
-
70
-
71
-
72
-
73
-
74
-
75
-
76
-
77
-
78
-
79
-
80
-
81
-
82
-
83
-
84
-
85
-
86
-
87
-
88
-
89
-
90
-
91
-
92
-
93
-
94
-
95
-
96
-
97
-
98
-
99
-
100
-
101
-
102
-
103
-
104
-
105
-
106
-
107
-
108
-
109
-
110
-
111
-
112
-
113
-
114
-
115
-
116
-
117
-
118
-
119
-
120
-
121
-
122
-
123
-
124
-
125
-
126
-
127
-
128
-
129
-
130
-
131
-
132
-
133
-
134
-
135
-
136
-
137
-
138
-
139
-
140
-
141
-
142
-
143
-
144
-
145
-
146
-
147
-
148
-
149
-
150
-
151
-
152
-
153
-
154
-
155
-
156
-
157
-
158
-
159
-
160
-
161
-
162
-
163
-
164
-
165
-
166
-
167
-
168
-
169
-
170
-
171
-
172
-
173
-
174
-
175
-
176
-
177
-
178
-
179
-
180
-
181
-
182
-
183
-
184
-
185
-
186
-
187
-
188
-
189
-
190
-
191
-
192
-
193
-
194
-
195
-
196
-
197
-
198
-
199
-
 200
200 -
 201
201 -
 202
202 -
 203
203 -
 204
204 -
 205
205 -
 206
206 -
 207
207 -
 208
208 -
 209
209 -
 210
210 -
 211
211 -
 212
212 -
 213
213 -
 214
214 -
 215
215 -
 216
216 -
 217
217 -
 218
218 -
 219
219 -
 220
220 -
221
-
222
-
223
-
224
-
225
-
226
-
227
-
228
-
229
-
230
-
231
-
232
-
233
-
234
-
235
-
236
-
237
-
238
-
239
-
240
-
241
-
242
-
243
-
244
-
245
-
246
-
247
-
248
-
249
-
250
-
251
-
252
-
253
-
254
-
255
-
256
-
257
-
258
-
259
-
260
-
261
-
262
-
263
-
264
 |
 |
adidas Group
/
2013 Annual Report
Consolidated Financial Statements
206
2013
/
04.8
/
Notes
/
Notes to the Consolidated Statement of Financial Position
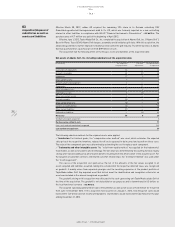
With respect to accounts receivable as at the balance sheet date past due but not impaired, based on credit history
and current credit ratings, there are no indications that customers will not be able to meet their obligations.
Further, no indications of default are recognisable for accounts receivable that are neither past due nor
impaired.
For further information about credit risks
/
SEE RISK AND OPPORTUNITY REPORT, P. 158.
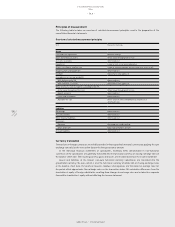
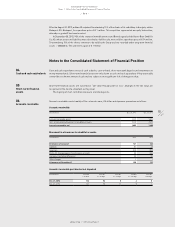
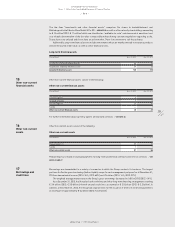
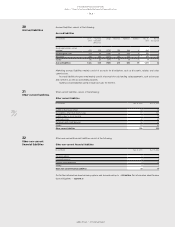
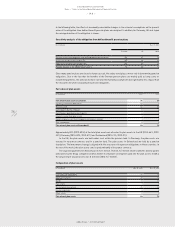
Other current financial assets consist of the following:
Other current financial assets
(€ in millions) Dec. 31, 2013 Dec. 31, 2012
Currency options 6 8
Forward contracts 47 53
Security deposits 69 82
Sundry 61 49
Other current financial assets 183 192
For further information about currency options and forward contracts
/
SEE NOTE 28.
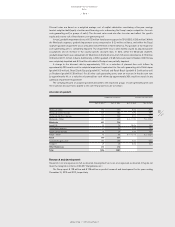
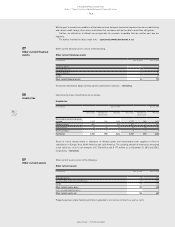
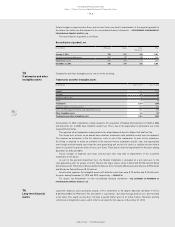
Inventories by major classification are as follows:
Inventories
(€ in millions) Dec. 31, 2013 Dec. 31, 2012
Gross value Allowance for
obsolescence
Net value Gross value Allowance for
obsolescence
Net value
Merchandise and finished goods
on hand 1,872 (69) 1,803 1,717 (80) 1,637
Goods in transit 800 — 800 817 — 817
Raw materials 31 (1) 30 27 (1) 26
Work in progress 1 — 1 6 — 6
Inventories 2,704 (70) 2,634 2,567 (81) 2,486
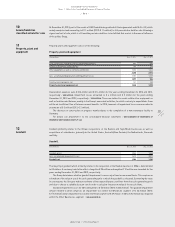
Goods in transit mainly relate to shipments of finished goods and merchandise from suppliers in Asia to
subsidiaries in Europe, Asia, North America and Latin America. The carrying amount of inventories measured
at fair value less costs to sell amounts to € 156 million and € 177 million as at December 31, 2013 and 2012,
respectively
/
SEE NOTE 02.
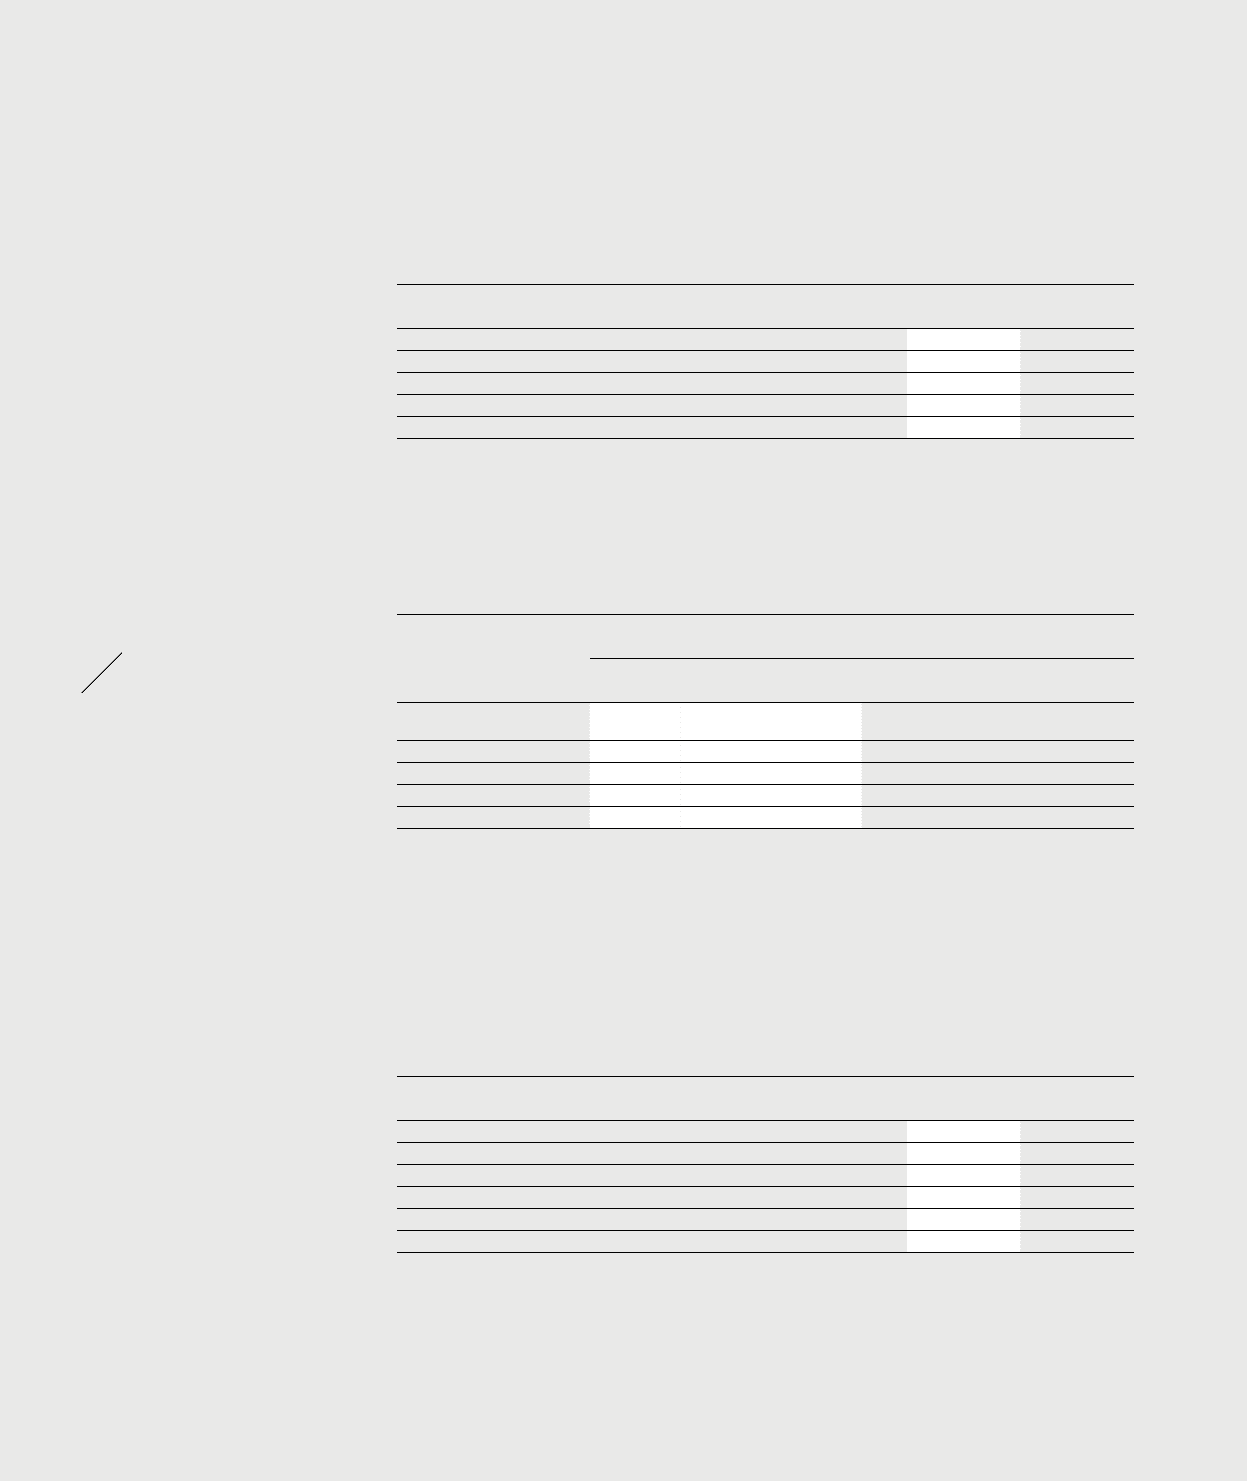
Other current assets consist of the following:
Other current assets
(€ in millions) Dec. 31, 2013 Dec. 31, 2012
Prepaid expenses 236 231
Tax receivables other than income taxes 133 136
Sundry 138 123
Other current assets, gross 507 490
Less: accumulated allowances 1 1
Other current assets, net 506 489
Prepaid expenses relate mainly to promotion agreements and service contracts as well as rents.
07
Other current financial
assets
08
Inventories
09
Other current assets